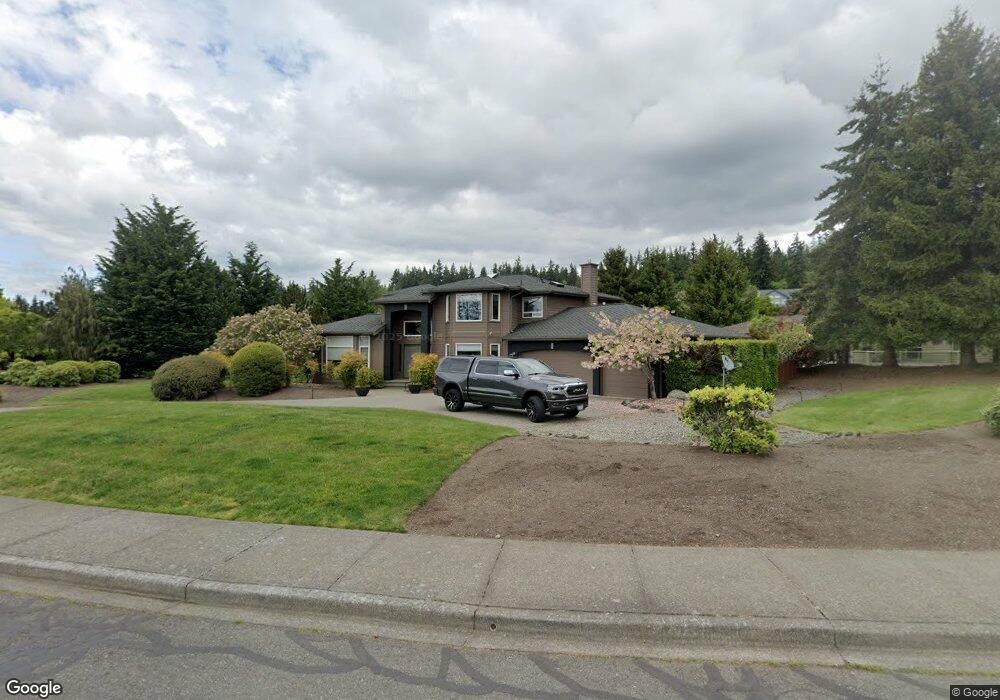
1718 Eagleridge Dr Bellingham, WA 98226
Estimated Value: $998,000 - $1,548,000
4
Beds
3
Baths
2,663
Sq Ft
$464/Sq Ft
Est. Value
About This Home
This home is located at 1718 Eagleridge Dr, Bellingham, WA 98226 and is currently estimated at $1,234,720, approximately $463 per square foot. 1718 Eagleridge Dr is a home located in Whatcom County with nearby schools including Silver Beach Elementary School, Whatcom Middle School, and Squalicum High School.
Ownership History
Date
Name
Owned For
Owner Type
Purchase Details
Closed on
Oct 25, 2011
Sold by
Barnes Glen A and Barnes Rian
Bought by
Rasmussen Robert C and Rasmussen Anne L
Current Estimated Value
Home Financials for this Owner
Home Financials are based on the most recent Mortgage that was taken out on this home.
Original Mortgage
$395,100
Outstanding Balance
$269,290
Interest Rate
4.01%
Mortgage Type
New Conventional
Estimated Equity
$965,430
Purchase Details
Closed on
Oct 27, 2006
Sold by
Hopkins Stacy L and Hopkins Patricia A
Bought by
Barnes Glen A and Barnes Rian
Home Financials for this Owner
Home Financials are based on the most recent Mortgage that was taken out on this home.
Original Mortgage
$382,000
Interest Rate
6.39%
Mortgage Type
Purchase Money Mortgage
Create a Home Valuation Report for This Property
The Home Valuation Report is an in-depth analysis detailing your home's value as well as a comparison with similar homes in the area
Home Values in the Area
Average Home Value in this Area
Purchase History
| Date | Buyer | Sale Price | Title Company |
|---|---|---|---|
| Rasmussen Robert C | $439,280 | Whatcom Land Title | |
| Barnes Glen A | $504,280 | Chicago Title Insurance |
Source: Public Records
Mortgage History
| Date | Status | Borrower | Loan Amount |
|---|---|---|---|
| Open | Rasmussen Robert C | $395,100 | |
| Previous Owner | Barnes Glen A | $382,000 |
Source: Public Records
Tax History Compared to Growth
Tax History
| Year | Tax Paid | Tax Assessment Tax Assessment Total Assessment is a certain percentage of the fair market value that is determined by local assessors to be the total taxable value of land and additions on the property. | Land | Improvement |
|---|---|---|---|---|
| 2024 | $9,690 | $1,085,924 | $427,680 | $658,244 |
| 2023 | $9,690 | $1,133,684 | $446,490 | $687,194 |
| 2022 | $7,715 | $921,695 | $363,000 | $558,695 |
| 2021 | $7,377 | $761,731 | $300,000 | $461,731 |
| 2020 | $7,127 | $684,222 | $257,021 | $427,201 |
| 2019 | $6,279 | $639,303 | $240,323 | $398,980 |
| 2018 | $6,510 | $573,416 | $215,573 | $357,843 |
| 2017 | $5,669 | $507,363 | $190,740 | $316,623 |
| 2016 | $5,236 | $461,132 | $173,580 | $287,552 |
| 2015 | $5,575 | $439,251 | $165,000 | $274,251 |
| 2014 | -- | $454,854 | $170,280 | $284,574 |
| 2013 | -- | $435,958 | $165,000 | $270,958 |
Source: Public Records
Map
Nearby Homes
- 1715 Eagleridge Dr
- 3108 NHN Northshore Rd
- 1555 Fairview St
- 1558 Fairview St
- 3401 E 17th Crest
- 1538 Fairview St
- 4521 Wall St
- 2959 Lake Whatcom Blvd
- 1402 Langara Cir
- 1851 Lakeside Ln
- 4541 Cable St
- 4640 Cable St
- 2933 Toad Lake Rd
- 4000 Flynn St Unit 50
- 4000 Flynn St Unit 107
- 4522 E Oregon St
- 4414 Alice St
- 4431 Alice St
- 4501 E Oregon St
- 2141 Northshore Rd
- 1716 Eagleridge Dr
- 1720 Eagleridge Dr
- 1761 Aquila Ct
- 1717 Eagle Ridge Dr
- 1717 Eagleridge Dr
- 3202 Eagleridge Way
- 1722 Eagleridge Dr
- 3199 Steller Ct
- 1713 Eagleridge Dr
- 1765 Aquila Ct
- 3194 Steller Ct
- 1760 Aquila Ct
- 1727 Eagleridge Dr
- 0 X N Shore Rd
- 2239 Northshore Rd
- 27 XX Northshore Rd
- 3020 Northshore Rd
- 1711 Eagleridge Dr
- 31 yy Northshore Rd
- 31 xx Northshore Rd