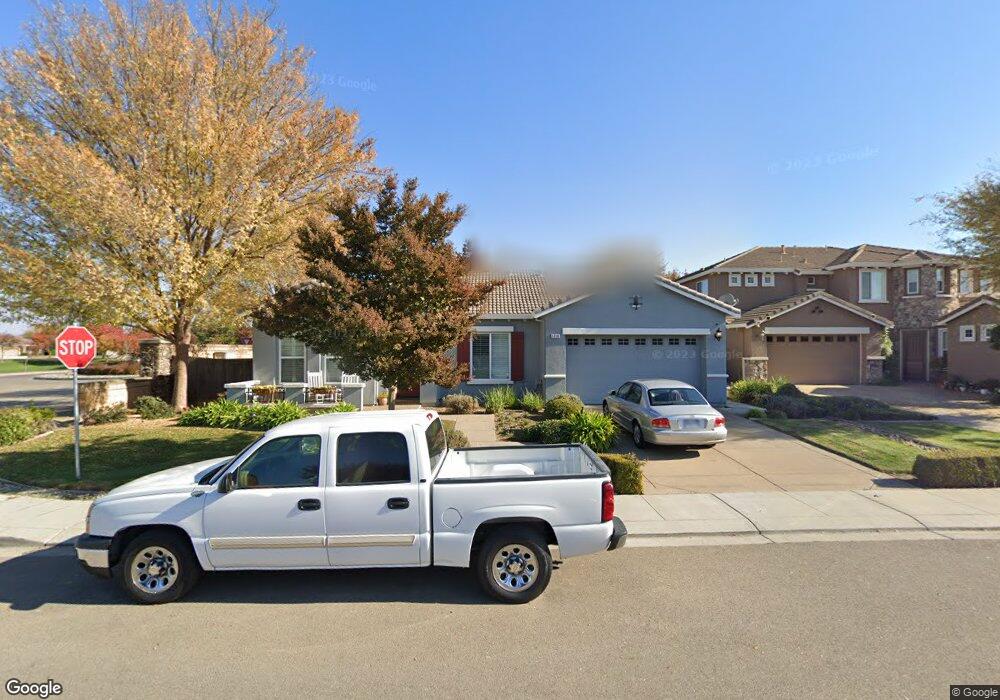
1718 Fiora Place Manteca, CA 95337
Estimated Value: $720,566 - $762,000
5
Beds
2
Baths
2,701
Sq Ft
$275/Sq Ft
Est. Value
About This Home
This home is located at 1718 Fiora Place, Manteca, CA 95337 and is currently estimated at $743,642, approximately $275 per square foot. 1718 Fiora Place is a home located in San Joaquin County with nearby schools including Walter Woodward Elementary School and Manteca High School.
Ownership History
Date
Name
Owned For
Owner Type
Purchase Details
Closed on
May 7, 2018
Sold by
Trevino Daniel and Trevino Vicky G
Bought by
Gail Vicky T and Trevino Daniel
Current Estimated Value
Home Financials for this Owner
Home Financials are based on the most recent Mortgage that was taken out on this home.
Interest Rate
4.55%
Purchase Details
Closed on
Jan 21, 2011
Sold by
Becker Kenneth and Shih Tambra
Bought by
Trevino Daniel and Trevino Vicky G
Home Financials for this Owner
Home Financials are based on the most recent Mortgage that was taken out on this home.
Original Mortgage
$175,000
Interest Rate
4.82%
Mortgage Type
New Conventional
Purchase Details
Closed on
Dec 26, 2006
Sold by
Woodside Ponte Verde Inc
Bought by
Becker Kenneth and Shih Tambra
Home Financials for this Owner
Home Financials are based on the most recent Mortgage that was taken out on this home.
Original Mortgage
$413,801
Interest Rate
7.37%
Mortgage Type
New Conventional
Create a Home Valuation Report for This Property
The Home Valuation Report is an in-depth analysis detailing your home's value as well as a comparison with similar homes in the area
Home Values in the Area
Average Home Value in this Area
Purchase History
| Date | Buyer | Sale Price | Title Company |
|---|---|---|---|
| Gail Vicky T | -- | -- | |
| Trevino Daniel | $259,000 | Commerce Title Company | |
| Becker Kenneth | $591,500 | Placer Title Company |
Source: Public Records
Mortgage History
| Date | Status | Borrower | Loan Amount |
|---|---|---|---|
| Closed | Gail Vicky T | -- | |
| Previous Owner | Trevino Daniel | $175,000 | |
| Previous Owner | Becker Kenneth | $413,801 |
Source: Public Records
Tax History Compared to Growth
Tax History
| Year | Tax Paid | Tax Assessment Tax Assessment Total Assessment is a certain percentage of the fair market value that is determined by local assessors to be the total taxable value of land and additions on the property. | Land | Improvement |
|---|---|---|---|---|
| 2025 | $5,151 | $331,814 | $81,990 | $249,824 |
| 2024 | $4,800 | $325,309 | $80,383 | $244,926 |
| 2023 | $4,756 | $318,931 | $78,807 | $240,124 |
| 2022 | $4,722 | $312,678 | $77,262 | $235,416 |
| 2021 | $4,683 | $306,548 | $75,748 | $230,800 |
| 2020 | $4,536 | $303,406 | $74,972 | $228,434 |
| 2019 | $4,482 | $297,457 | $73,502 | $223,955 |
| 2018 | $4,480 | $291,625 | $72,061 | $219,564 |
| 2017 | $4,417 | $285,908 | $70,649 | $215,259 |
| 2016 | $4,340 | $280,303 | $69,264 | $211,039 |
| 2014 | $3,984 | $270,686 | $66,888 | $203,798 |
Source: Public Records
Map
Nearby Homes
- 1271 Veteran St
- 1807 Birdie Ave
- 1310 Veteran St
- 1266 Veteran St
- 1294 Grafton Ct
- 1175 Miel St
- 1581 Veteran St
- 1114 Balzo St
- 1816 Fire Power Ave
- 1773 Lana Way
- 984 E Woodward Ave
- 1471 Bosco Ln
- 864 Heartland Dr
- 1573 Tannehill Dr
- 1362 Tannehill Dr
- 2261 Pillsbury Rd
- 769 Dody Dr
- 1502 Churcher Dr
- 2341 Azevedo Ave
- 806 Mono St
- 1732 Fiora Place
- 1746 Fiora Place
- 1350 Tesoro Dr
- 1338 Tesoro Dr
- 1758 Fiora Place
- 1719 Amato Way
- 1745 Fiora Place
- 1746 Amato Way
- 1733 Amato Way
- 1747 Amato Way
- 1771 Fiora Place
- 1326 Tesoro Dr
- 1757 Fiora Place
- 1758 Amato Way
- 1759 Amato Way
- 1457 W Woodward Ave
- 1469 W Woodward Ave
- 1463 W Woodward Ave
- 1481 W Woodward Ave
- 1742 Tesoro Place