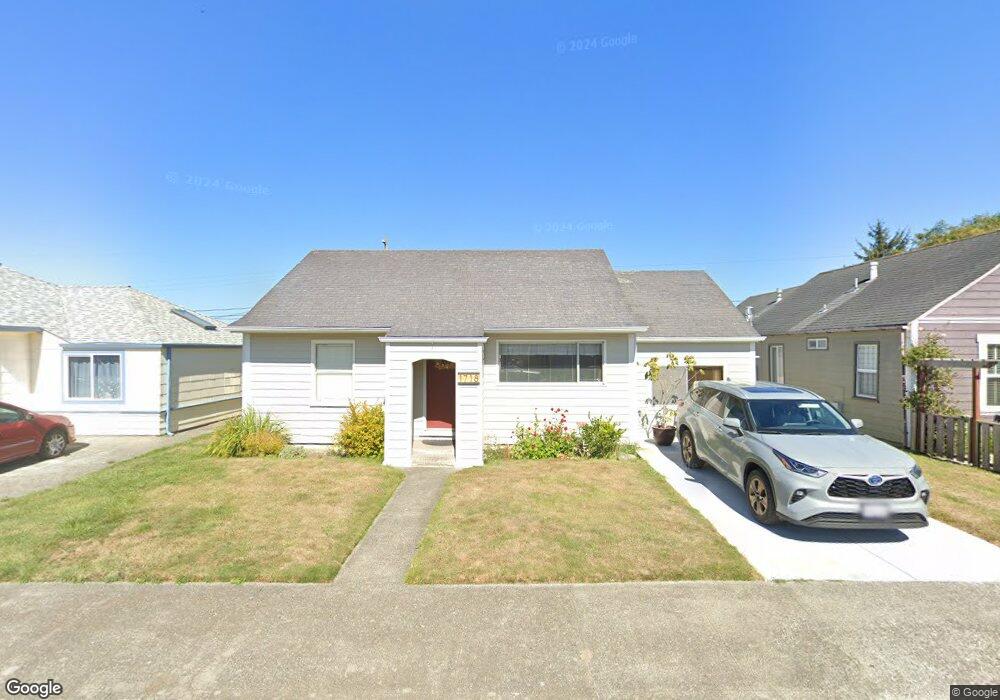
1718 Iverson Ave Arcata, CA 95521
Greenview-Windsong NeighborhoodEstimated Value: $292,930 - $401,000
3
Beds
1
Bath
764
Sq Ft
$465/Sq Ft
Est. Value
About This Home
This home is located at 1718 Iverson Ave, Arcata, CA 95521 and is currently estimated at $355,233, approximately $464 per square foot. 1718 Iverson Ave is a home located in Humboldt County with nearby schools including Arcata Elementary School, Sunny Brae Middle School, and Arcata High School.
Ownership History
Date
Name
Owned For
Owner Type
Purchase Details
Closed on
Aug 30, 2018
Sold by
Howard Birnie James and Bea Earlene
Bought by
Reed Jay E and Reed Nicole M
Current Estimated Value
Purchase Details
Closed on
Sep 6, 2000
Sold by
Birnie James Howard and Birnie James H
Bought by
Birnie James Howard and Birnie Earlene Bea
Purchase Details
Closed on
Jun 21, 2000
Sold by
Birnie Lillian L
Bought by
Birnie Lillian L and Birnie James H
Create a Home Valuation Report for This Property
The Home Valuation Report is an in-depth analysis detailing your home's value as well as a comparison with similar homes in the area
Home Values in the Area
Average Home Value in this Area
Purchase History
We collect this data history from publicly available records. To have your information removed, we recommend requesting removal directly through your county’s website.
| Date | Buyer | Sale Price | Title Company |
|---|---|---|---|
| Reed Jay E | $275,000 | Humboldt Land Title | |
| Birnie James Howard | -- | -- | |
| Birnie Lillian L | -- | -- |
Source: Public Records
Tax History
| Year | Tax Paid | Tax Assessment Tax Assessment Total Assessment is a certain percentage of the fair market value that is determined by local assessors to be the total taxable value of land and additions on the property. | Land | Improvement |
|---|---|---|---|---|
| 2025 | $802 | $51,844 | $9,007 | $42,837 |
| 2024 | $802 | $50,829 | $8,831 | $41,998 |
| 2023 | $790 | $49,833 | $8,658 | $41,175 |
| 2022 | $796 | $48,857 | $8,489 | $40,368 |
| 2021 | $769 | $47,900 | $8,323 | $39,577 |
| 2020 | $644 | $47,410 | $8,238 | $39,172 |
| 2019 | $627 | $46,481 | $8,077 | $38,404 |
| 2018 | $692 | $45,570 | $7,919 | $37,651 |
| 2017 | $673 | $44,677 | $7,764 | $36,913 |
| 2016 | $637 | $43,802 | $7,612 | $36,190 |
| 2015 | $631 | $43,145 | $7,498 | $35,647 |
| 2014 | $667 | $42,301 | $7,352 | $34,949 |
Source: Public Records
Map
Nearby Homes
- 1717 Iverson Ave
- 1565 Q St
- 1727 Iverson Ave
- 1718 Blakeslee Ave
- 1737 Iverson Ave
- 1525 Q St
- 1728 Blakeslee Ave
- 1738 Blakeslee Ave
- 1747 Iverson Ave
- 1621 Q St
- 1728 Iverson Ave
- 1748 Blakeslee Ave
- 1738 Iverson Ave
- 1757 Iverson Ave
- 1748 Iverson Ave
- 1758 Blakeslee Ave
- 1712 Zehndner Ave
- 1717 Blakeslee Ave
- 1758 Iverson Ave
- 1767 Iverson Ave
Your Personal Tour Guide
Ask me questions while you tour the home.