Estimated Value: $290,674 - $435,000
Studio
2
Baths
1,726
Sq Ft
$197/Sq Ft
Est. Value
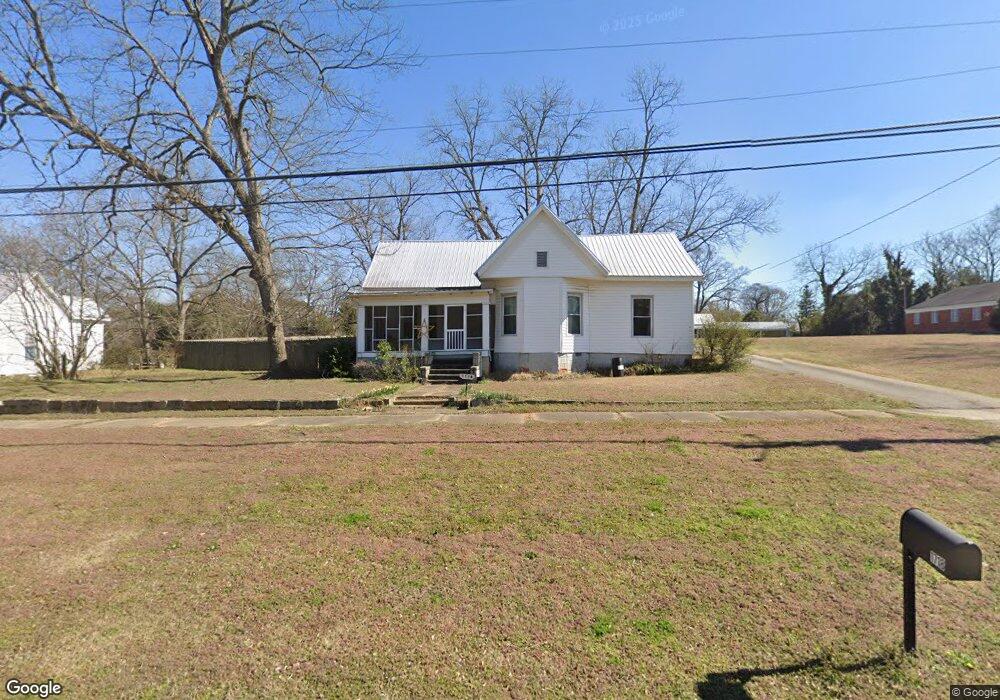
About This Home
This home is located at 1718 Main St, Comer, GA 30629 and is currently estimated at $339,669, approximately $196 per square foot. 1718 Main St is a home located in Madison County with nearby schools including Madison County High School.
Ownership History
Date
Name
Owned For
Owner Type
Purchase Details
Closed on
Oct 12, 2021
Sold by
Nettles Coates Sydney
Bought by
Dybdahl Peter and Martin Angela
Current Estimated Value
Purchase Details
Closed on
Sep 19, 2019
Sold by
Harwell Marsha A
Bought by
Coates Sydney Nettles
Home Financials for this Owner
Home Financials are based on the most recent Mortgage that was taken out on this home.
Original Mortgage
$60,000
Interest Rate
3.5%
Mortgage Type
New Conventional
Purchase Details
Closed on
Feb 26, 2019
Sold by
White Billie N
Bought by
Harwell Marsha A and White Darrell N
Purchase Details
Closed on
Jan 1, 1967
Bought by
White Billie N
Create a Home Valuation Report for This Property
The Home Valuation Report is an in-depth analysis detailing your home's value as well as a comparison with similar homes in the area
Purchase History
| Date | Buyer | Sale Price | Title Company |
|---|---|---|---|
| Dybdahl Peter | $247,500 | -- | |
| Coates Sydney Nettles | $80,000 | -- | |
| Harwell Marsha A | -- | -- | |
| White Billie N | -- | -- |
Source: Public Records
Mortgage History
| Date | Status | Borrower | Loan Amount |
|---|---|---|---|
| Previous Owner | Coates Sydney Nettles | $60,000 |
Source: Public Records
Tax History
| Year | Tax Paid | Tax Assessment Tax Assessment Total Assessment is a certain percentage of the fair market value that is determined by local assessors to be the total taxable value of land and additions on the property. | Land | Improvement |
|---|---|---|---|---|
| 2025 | $3,273 | $109,903 | $8,191 | $101,712 |
| 2024 | $3,270 | $106,639 | $8,191 | $98,448 |
| 2023 | $2,462 | $98,705 | $6,826 | $91,879 |
| 2022 | $2,695 | $86,009 | $4,693 | $81,316 |
| 2021 | $1,121 | $32,833 | $4,693 | $28,140 |
| 2020 | $973 | $32,150 | $4,010 | $28,140 |
| 2019 | $703 | $31,550 | $4,010 | $27,540 |
| 2018 | $682 | $30,840 | $3,669 | $27,171 |
| 2017 | $1,104 | $32,114 | $3,413 | $28,701 |
| 2016 | $529 | $27,544 | $3,103 | $24,441 |
| 2015 | $526 | $27,544 | $3,103 | $24,441 |
| 2014 | $563 | $28,794 | $4,189 | $24,605 |
| 2013 | -- | $28,794 | $4,189 | $24,605 |
Source: Public Records
Map
Nearby Homes
- 79 Gholston St
- 113 Sidetrack Cir
- 540 Sunset Ave
- 77 Laurel Ave
- 12 Laurel Ave
- 0 Clairmont Ave Unit 10700774
- 549 Gholston St
- 640 Gholston St
- 1360 Hill St
- 2633 Paoli St Unit TRACT 1
- 2665 Paoli St Unit TRACT 3
- 130 Shannons Place
- 10 Shannons Ln
- 116 Scarlett Oak Ln
- 52 Willow Oak Cir
- 0 Lowe Rd Unit 10614126
- 2975 Georgia 72
- 1104 Farm Rd
- 0 Paoli Rd Unit 23882833
- 2987 Georgia 72
Your Personal Tour Guide
Ask me questions while you tour the home.