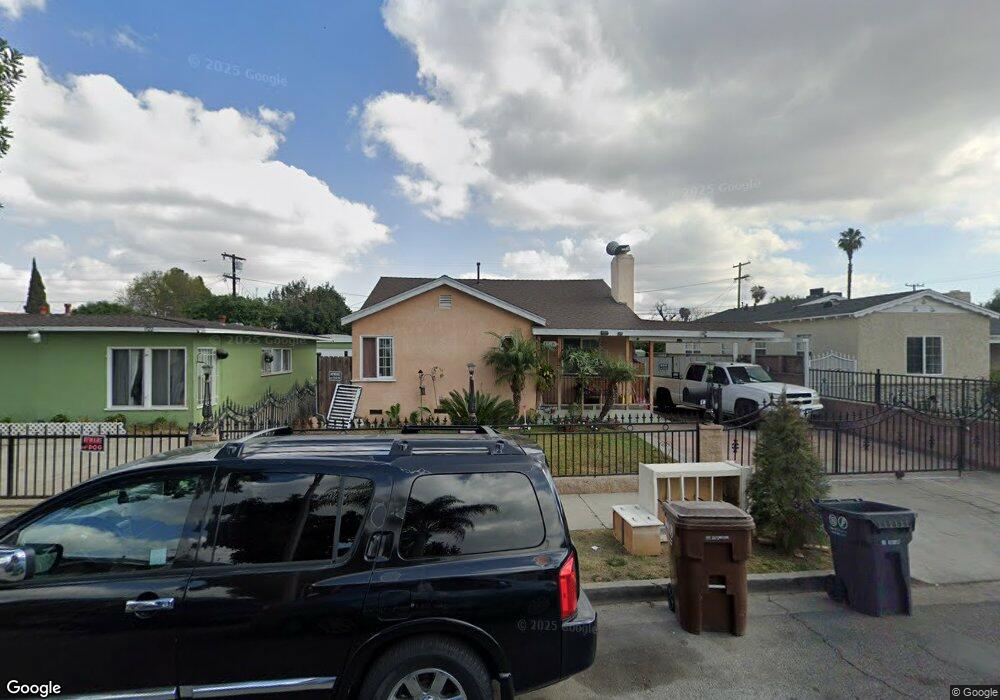
1718 N Spring Ave Compton, CA 90221
Estimated Value: $619,000 - $665,000
3
Beds
2
Baths
1,324
Sq Ft
$491/Sq Ft
Est. Value
About This Home
This home is located at 1718 N Spring Ave, Compton, CA 90221 and is currently estimated at $650,488, approximately $491 per square foot. 1718 N Spring Ave is a home located in Los Angeles County with nearby schools including Foster Elementary School, Bunche Middle School, and Dominguez High School.
Ownership History
Date
Name
Owned For
Owner Type
Purchase Details
Closed on
May 19, 2010
Sold by
Steelhead 2010-2 Llc
Bought by
Salas Michael and Salas Diana Maricela
Current Estimated Value
Home Financials for this Owner
Home Financials are based on the most recent Mortgage that was taken out on this home.
Original Mortgage
$250,267
Outstanding Balance
$169,053
Interest Rate
5.21%
Mortgage Type
VA
Estimated Equity
$481,435
Purchase Details
Closed on
Dec 21, 2009
Sold by
Aurora Loan Services Llc
Bought by
Steelhead 2010-2 Llc
Purchase Details
Closed on
Oct 16, 2009
Sold by
Holguin Angelica
Bought by
Aurora Loan Services Llc
Purchase Details
Closed on
Oct 19, 2006
Sold by
Mann Betty and Mann Betty L
Bought by
Holguin Angelica
Home Financials for this Owner
Home Financials are based on the most recent Mortgage that was taken out on this home.
Original Mortgage
$305,600
Interest Rate
6.07%
Mortgage Type
Purchase Money Mortgage
Create a Home Valuation Report for This Property
The Home Valuation Report is an in-depth analysis detailing your home's value as well as a comparison with similar homes in the area
Home Values in the Area
Average Home Value in this Area
Purchase History
| Date | Buyer | Sale Price | Title Company |
|---|---|---|---|
| Salas Michael | $245,000 | Lawyers Title | |
| Steelhead 2010-2 Llc | $135,000 | Lsi Title Agency Inc | |
| Aurora Loan Services Llc | $341,547 | Accommodation | |
| Holguin Angelica | $382,000 | Chicago |
Source: Public Records
Mortgage History
| Date | Status | Borrower | Loan Amount |
|---|---|---|---|
| Open | Salas Michael | $250,267 | |
| Previous Owner | Holguin Angelica | $305,600 |
Source: Public Records
Tax History
| Year | Tax Paid | Tax Assessment Tax Assessment Total Assessment is a certain percentage of the fair market value that is determined by local assessors to be the total taxable value of land and additions on the property. | Land | Improvement |
|---|---|---|---|---|
| 2025 | $6,020 | $316,235 | $119,263 | $196,972 |
| 2024 | $6,020 | $310,035 | $116,925 | $193,110 |
| 2023 | $5,940 | $303,957 | $114,633 | $189,324 |
| 2022 | $5,294 | $297,998 | $112,386 | $185,612 |
| 2021 | $5,345 | $292,156 | $110,183 | $181,973 |
| 2019 | $5,193 | $283,493 | $106,916 | $176,577 |
| 2018 | $5,012 | $277,935 | $104,820 | $173,115 |
| 2016 | $4,770 | $267,144 | $100,750 | $166,394 |
| 2015 | $4,560 | $263,132 | $99,237 | $163,895 |
| 2014 | $4,229 | $242,000 | $91,200 | $150,800 |
Source: Public Records
Map
Nearby Homes
- 1415 N Spring Ave
- 1503 N Chester Ave
- 1701 N Pearl Ave
- 1111 N Spring Ave
- 406 E Rosecrans Ave
- 1111 N Mulberry St
- 212 E Rosecrans Ave
- 3130 Euclid Ave
- 921 E Pine St
- 904 E Stockton Ave
- 12444 Santa fe Ave
- 2605 E 132nd St
- 1000 N Mayo Ave
- 124 W Rosecrans Ave
- 3161 Euclid Ave
- 604 N Santa fe Ave
- 702 N Willowbrook Ave
- 2545 E 131st St
- 2310 E Stockwell St
- 3150 -62 Euclid Ave
- 1722 N Spring Ave
- 1714 N Spring Ave
- 1726 N Spring Ave
- 1710 N Spring Ave
- 1719 N Mcdivitt Ave
- 1719 N Mcdivitt Ave
- 1723 N Mcdivitt Ave
- 1713 N Mcdivitt Ave Unit 1
- 1713 N Mcdivitt Ave
- 1725 N Mcdivitt Ave
- 1706 N Spring Ave
- 1728 N Spring Ave
- 1711 N Mcdivitt Ave
- 1717 N Spring Ave
- 1715 N Spring Ave
- 1723 N Spring Ave
- 1731 N Mcdivitt Ave
- 1709 N Spring Ave
- 1705 N Mcdivitt Ave
- 1727 N Spring Ave
Your Personal Tour Guide
Ask me questions while you tour the home.