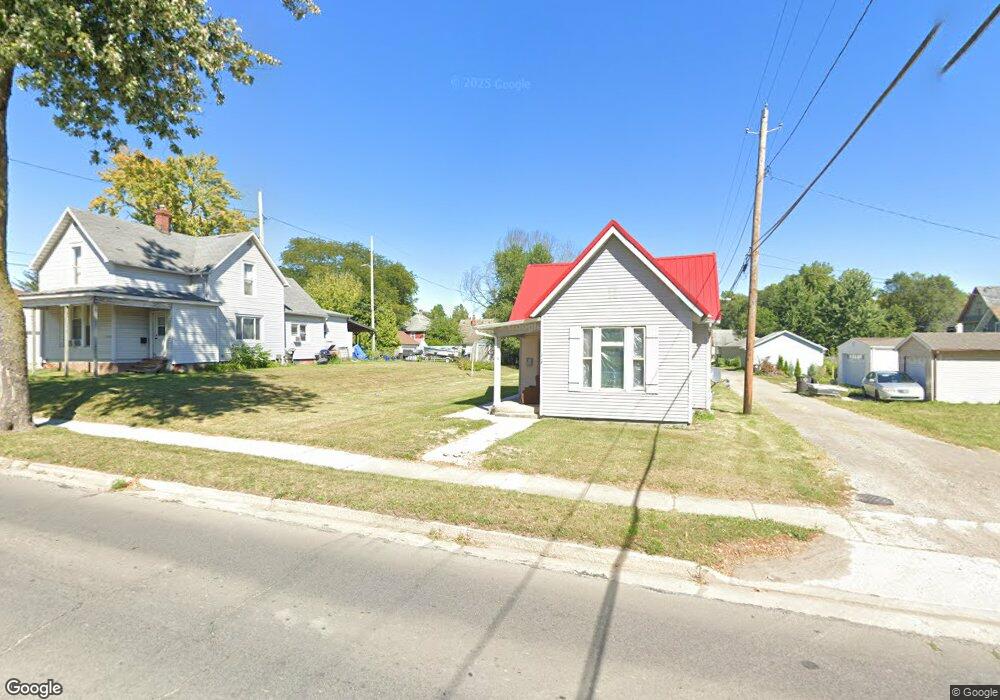
1718 Sherman Blvd Fort Wayne, IN 46808
Bloomingdale NeighborhoodEstimated Value: $122,000 - $162,000
3
Beds
1
Bath
852
Sq Ft
$166/Sq Ft
Est. Value
About This Home
This home is located at 1718 Sherman Blvd, Fort Wayne, IN 46808 and is currently estimated at $141,781, approximately $166 per square foot. 1718 Sherman Blvd is a home located in Allen County with nearby schools including Bloomingdale Elementary School, Lakeside Middle School, and North Side High School.
Ownership History
Date
Name
Owned For
Owner Type
Purchase Details
Closed on
Jul 8, 2011
Sold by
First Federal Savings Bank
Bought by
Mendez Murillo Leopoldo Alberto
Current Estimated Value
Purchase Details
Closed on
Feb 10, 2011
Sold by
Cityco Llc and Butler Robert
Bought by
First Savings Bank
Purchase Details
Closed on
Nov 28, 2003
Sold by
Hud
Bought by
Cityco Llc
Purchase Details
Closed on
Aug 5, 2003
Sold by
Abn Amro Mortgage Group Inc
Bought by
Hud
Purchase Details
Closed on
Jul 29, 2003
Sold by
Wiard Dori L
Bought by
Abn Amro Mortgage Group Inc
Purchase Details
Closed on
Sep 11, 2001
Sold by
Taylor Elizabeth L
Bought by
Wiard Dori
Home Financials for this Owner
Home Financials are based on the most recent Mortgage that was taken out on this home.
Original Mortgage
$45,443
Interest Rate
7.06%
Mortgage Type
FHA
Purchase Details
Closed on
Jan 17, 2001
Sold by
Taylor Thomas L and Taylor Elizabeth L
Bought by
Taylor Elizabeth L
Create a Home Valuation Report for This Property
The Home Valuation Report is an in-depth analysis detailing your home's value as well as a comparison with similar homes in the area
Home Values in the Area
Average Home Value in this Area
Purchase History
| Date | Buyer | Sale Price | Title Company |
|---|---|---|---|
| Mendez Murillo Leopoldo Alberto | -- | None Available | |
| First Savings Bank | -- | None Available | |
| Cityco Llc | -- | Contract Processing & Title | |
| Hud | -- | -- | |
| Abn Amro Mortgage Group Inc | $51,156 | -- | |
| Wiard Dori | -- | Commonwealth Land Title Co | |
| Taylor Elizabeth L | -- | -- |
Source: Public Records
Mortgage History
| Date | Status | Borrower | Loan Amount |
|---|---|---|---|
| Previous Owner | Wiard Dori | $45,443 |
Source: Public Records
Tax History Compared to Growth
Tax History
| Year | Tax Paid | Tax Assessment Tax Assessment Total Assessment is a certain percentage of the fair market value that is determined by local assessors to be the total taxable value of land and additions on the property. | Land | Improvement |
|---|---|---|---|---|
| 2024 | $1,488 | $63,500 | $10,400 | $53,100 |
| 2022 | $1,155 | $51,400 | $12,600 | $38,800 |
| 2021 | $1,048 | $46,800 | $6,800 | $40,000 |
| 2020 | $906 | $41,400 | $6,200 | $35,200 |
| 2019 | $819 | $37,600 | $5,800 | $31,800 |
| 2018 | $721 | $32,900 | $5,600 | $27,300 |
| 2017 | $599 | $27,100 | $5,500 | $21,600 |
| 2016 | $582 | $26,700 | $5,700 | $21,000 |
| 2014 | $574 | $27,600 | $6,900 | $20,700 |
| 2013 | $480 | $23,100 | $5,700 | $17,400 |
Source: Public Records
Map
Nearby Homes
- 825 Putnam St
- 1731 Andrew St
- 1511 Oakland St
- 2015 Hensch St
- 808 Florence Ave
- 1214 Spring St
- 1117 3rd St
- 415 Huffman St
- 619 3rd St
- 1414 W 4th St
- 604 W State Blvd
- 2502 Sherman Blvd
- 504 W State Blvd
- 1522 Spring St
- 2405 Cass St
- 1316 Sinclair St
- 1143 Saint Marys Ave
- 1305 Sinclair St
- 714 Irene Ave
- 718 Irene Ave
- 1724 Sherman Blvd
- 820 Huffman St
- 816 Huffman St
- 1719 Andrew St
- 1717 Andrew St
- 823 Putnam St
- 823 Putnam St Unit 1/2
- 823 Putnam St Unit 1
- 823 Putnam St Unit 2
- 812 Huffman St
- 831 Putnam St
- 819 Putnam St
- 815 Putnam St
- 1723 Sherman Blvd
- 806 Huffman St
- 908 Huffman St
- 809 Putnam St
- 1715 Andrew St
- 1725 Andrew St
- 902 Huffman St