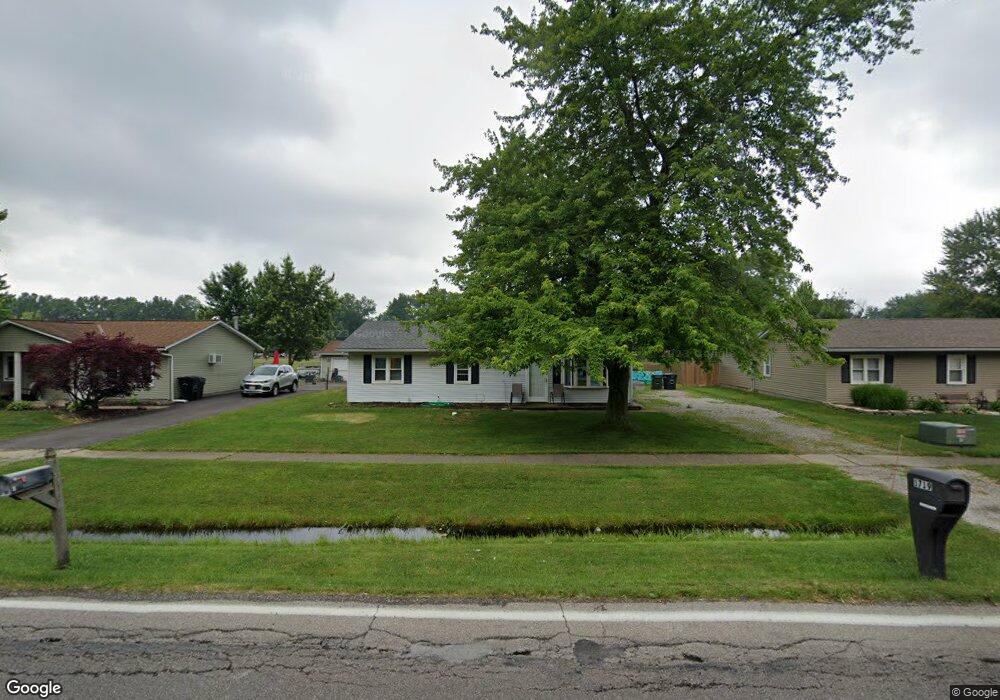
1719 Abbe Rd S Elyria, OH 44035
Estimated Value: $111,000 - $175,000
3
Beds
2
Baths
1,008
Sq Ft
$143/Sq Ft
Est. Value
About This Home
This home is located at 1719 Abbe Rd S, Elyria, OH 44035 and is currently estimated at $144,597, approximately $143 per square foot. 1719 Abbe Rd S is a home located in Lorain County with nearby schools including Eastern Heights Middle School, Elyria High School, and Constellation Schools: Elyria Community Elementary.
Ownership History
Date
Name
Owned For
Owner Type
Purchase Details
Closed on
Jun 1, 2021
Sold by
Baker Anthony C
Bought by
Cunningham Cruz Jeffrey M and Cruz Alexandra K
Current Estimated Value
Home Financials for this Owner
Home Financials are based on the most recent Mortgage that was taken out on this home.
Original Mortgage
$1,875
Outstanding Balance
$1,700
Interest Rate
3%
Mortgage Type
Stand Alone Second
Estimated Equity
$142,897
Purchase Details
Closed on
May 29, 2001
Sold by
Large Joel A and Large Heather L
Bought by
Baker Anthony C
Home Financials for this Owner
Home Financials are based on the most recent Mortgage that was taken out on this home.
Original Mortgage
$91,248
Outstanding Balance
$34,860
Interest Rate
7.18%
Mortgage Type
FHA
Estimated Equity
$109,737
Create a Home Valuation Report for This Property
The Home Valuation Report is an in-depth analysis detailing your home's value as well as a comparison with similar homes in the area
Home Values in the Area
Average Home Value in this Area
Purchase History
| Date | Buyer | Sale Price | Title Company |
|---|---|---|---|
| Cunningham Cruz Jeffrey M | $75,000 | Old Republic Natl Ttl Ins Co | |
| Baker Anthony C | $92,500 | Lorain County Title Co Inc |
Source: Public Records
Mortgage History
| Date | Status | Borrower | Loan Amount |
|---|---|---|---|
| Open | Cunningham Cruz Jeffrey M | $1,875 | |
| Closed | Cunningham Cruz Jeffrey M | $1,875 | |
| Open | Baker Anthony C | $91,248 |
Source: Public Records
Tax History
| Year | Tax Paid | Tax Assessment Tax Assessment Total Assessment is a certain percentage of the fair market value that is determined by local assessors to be the total taxable value of land and additions on the property. | Land | Improvement |
|---|---|---|---|---|
| 2024 | $1,898 | $40,110 | $12,996 | $27,115 |
| 2023 | $1,645 | $30,181 | $10,014 | $20,167 |
| 2022 | $1,671 | $30,181 | $10,014 | $20,167 |
| 2021 | $1,667 | $30,181 | $10,014 | $20,167 |
| 2020 | $1,565 | $25,050 | $8,310 | $16,740 |
| 2019 | $1,523 | $25,050 | $8,310 | $16,740 |
| 2018 | $1,517 | $25,050 | $8,310 | $16,740 |
| 2017 | $1,509 | $23,740 | $8,410 | $15,330 |
| 2016 | $1,489 | $23,740 | $8,410 | $15,330 |
| 2015 | $1,395 | $23,740 | $8,410 | $15,330 |
| 2014 | $1,351 | $23,280 | $8,250 | $15,030 |
| 2013 | $1,338 | $23,280 | $8,250 | $15,030 |
Source: Public Records
Map
Nearby Homes
- 475 Carol Ln
- 459 Auburn St
- 418 Carol Ln
- 246 Syracuse Ct
- 436 Bayberry Dr
- 124 Oakley Green Dr
- 121 Oakley Green Dr Unit 13
- 310 Carol Ln
- 219 Bridgeport Dr Unit 35
- 133 Gleneagle Dr Unit 47
- 715 Carol Ln
- 128 Richmond Ct
- 134 Richmond Ct
- 10273 E River Rd
- 148 Bentley Dr Unit 25
- 154 Bentley Dr
- 9929 E River Rd
- 39046 E River Rd
- 523 Purdue Ave
- 746 Delaware Ave
Your Personal Tour Guide
Ask me questions while you tour the home.