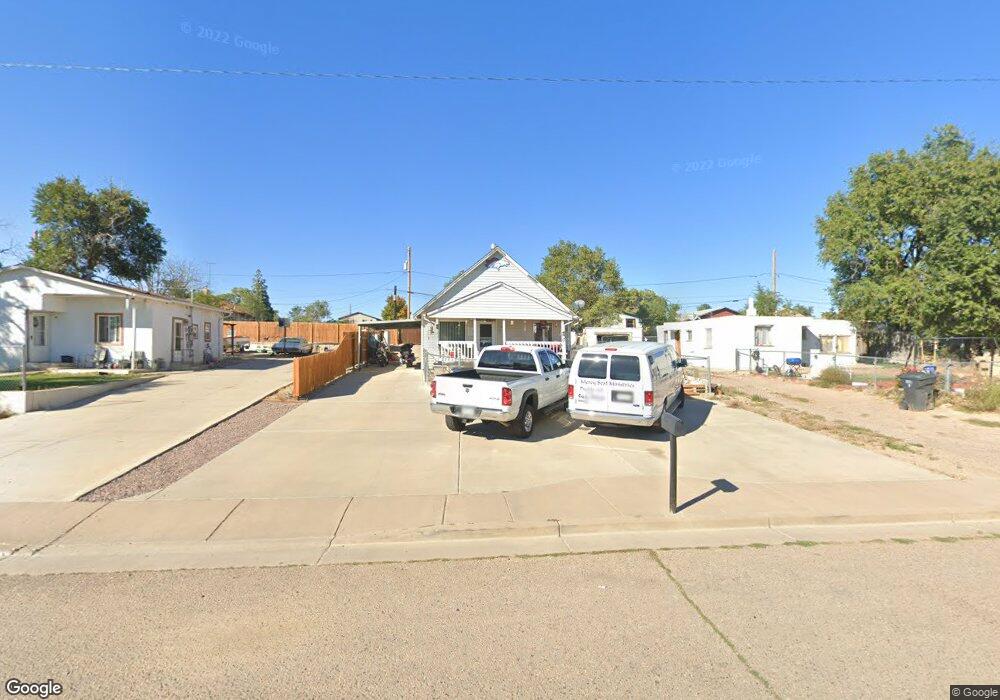
1719 E Ash St Pueblo, CO 81001
Lower East Side NeighborhoodEstimated Value: $82,000 - $155,000
2
Beds
1
Bath
732
Sq Ft
$172/Sq Ft
Est. Value
About This Home
This home is located at 1719 E Ash St, Pueblo, CO 81001 and is currently estimated at $125,633, approximately $171 per square foot. 1719 E Ash St is a home located in Pueblo County with nearby schools including Bradford Elementary School, Risley International Academy of Innovation, and East High School.
Ownership History
Date
Name
Owned For
Owner Type
Purchase Details
Closed on
Mar 5, 1997
Sold by
Sisneros Peggy + Salomon
Bought by
Same
Current Estimated Value
Purchase Details
Closed on
Nov 12, 1986
Sold by
Granillo Peggy
Purchase Details
Closed on
Jul 15, 1986
Bought by
Granillo Peggy +
Purchase Details
Closed on
Jun 23, 1986
Sold by
'
Purchase Details
Closed on
Apr 17, 1986
Purchase Details
Closed on
Jan 16, 1979
Sold by
Vigil Flora +
Purchase Details
Closed on
Sep 22, 1972
Sold by
Same
Bought by
Vigil Flora + Joe
Create a Home Valuation Report for This Property
The Home Valuation Report is an in-depth analysis detailing your home's value as well as a comparison with similar homes in the area
Home Values in the Area
Average Home Value in this Area
Purchase History
| Date | Buyer | Sale Price | Title Company |
|---|---|---|---|
| Same | -- | -- | |
| Sisneros Peggy + Salomon | -- | -- | |
| -- | -- | -- | |
| Granillo Peggy + | -- | -- | |
| -- | -- | -- | |
| -- | -- | -- | |
| -- | -- | -- | |
| Vigil Flora + Joe | $8,000 | -- |
Source: Public Records
Tax History
| Year | Tax Paid | Tax Assessment Tax Assessment Total Assessment is a certain percentage of the fair market value that is determined by local assessors to be the total taxable value of land and additions on the property. | Land | Improvement |
|---|---|---|---|---|
| 2024 | $446 | $4,500 | -- | -- |
| 2023 | $452 | $8,190 | $1,010 | $7,180 |
| 2022 | $440 | $4,430 | $380 | $4,050 |
| 2021 | $454 | $4,560 | $390 | $4,170 |
| 2020 | $329 | $4,560 | $390 | $4,170 |
| 2019 | $329 | $3,256 | $165 | $3,091 |
| 2018 | $216 | $2,380 | $166 | $2,214 |
| 2017 | $218 | $2,380 | $166 | $2,214 |
| 2016 | $206 | $2,270 | $184 | $2,086 |
| 2015 | $205 | $2,270 | $184 | $2,086 |
| 2014 | $240 | $2,650 | $184 | $2,466 |
Source: Public Records
Map
Nearby Homes
- 1710 E Ash St
- 1632 E 2nd St
- 1520 E Ash St
- 1826 E 2nd St
- 1710 E 3rd St
- 1909 E 2nd St
- 1430 E Beech St
- 2908 1/2 E 4th St
- 0000 E Beech St
- 1912 E 5th St
- 1406 Brewery Rd
- 1410 Brewery Rd
- 1510 Grenadillo St
- 1420 Brewery Rd
- 717 E Ash St
- 1505 E 6th St
- 1506 E 7th St
- 1424 Rivers Run Ave
- 1910 E 8th St
- 1205 E 1st St
Your Personal Tour Guide
Ask me questions while you tour the home.