1719 E Mountain View Rd Phoenix, AZ 85020
North Central NeighborhoodEstimated Value: $544,000 - $909,062
4
Beds
3
Baths
2,343
Sq Ft
$326/Sq Ft
Est. Value
About This Home
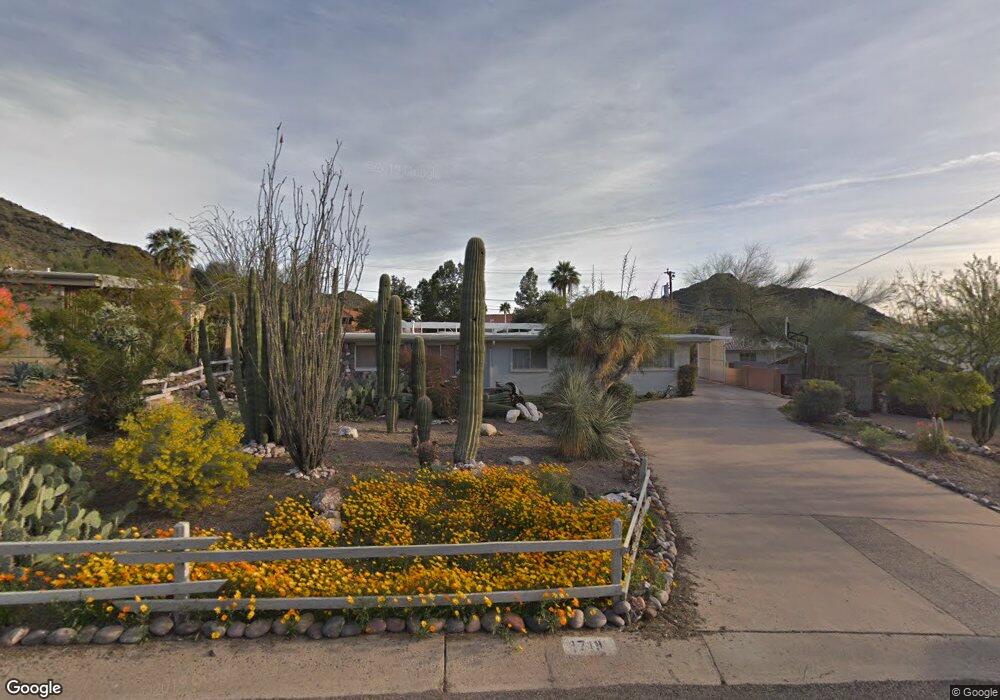
This home is located at 1719 E Mountain View Rd, Phoenix, AZ 85020 and is currently estimated at $762,766, approximately $325 per square foot. 1719 E Mountain View Rd is a home located in Maricopa County with nearby schools including Mercury Mine Elementary School, Shea Middle School, and Shadow Mountain High School.
Ownership History
Date
Name
Owned For
Owner Type
Purchase Details
Closed on
Jan 29, 2001
Sold by
Pang David Y and Pang Daphne W
Bought by
Pang David Y and Pang Daphne W
Current Estimated Value
Create a Home Valuation Report for This Property
The Home Valuation Report is an in-depth analysis detailing your home's value as well as a comparison with similar homes in the area
Home Values in the Area
Average Home Value in this Area
Purchase History
| Date | Buyer | Sale Price | Title Company |
|---|---|---|---|
| Pang David Y | -- | -- | |
| Pang David Y | -- | -- | |
| Pang David Y | -- | -- |
Source: Public Records
Tax History
| Year | Tax Paid | Tax Assessment Tax Assessment Total Assessment is a certain percentage of the fair market value that is determined by local assessors to be the total taxable value of land and additions on the property. | Land | Improvement |
|---|---|---|---|---|
| 2025 | $2,814 | $32,498 | -- | -- |
| 2024 | $2,679 | $30,950 | -- | -- |
| 2023 | $2,679 | $51,370 | $10,270 | $41,100 |
| 2022 | $2,654 | $39,870 | $7,970 | $31,900 |
| 2021 | $2,698 | $37,120 | $7,420 | $29,700 |
| 2020 | $2,606 | $32,630 | $6,520 | $26,110 |
| 2019 | $2,617 | $30,430 | $6,080 | $24,350 |
| 2018 | $2,522 | $31,210 | $6,240 | $24,970 |
| 2017 | $1,778 | $25,460 | $5,090 | $20,370 |
| 2016 | $1,750 | $25,170 | $5,030 | $20,140 |
| 2015 | $1,623 | $23,280 | $4,650 | $18,630 |
Source: Public Records
Map
Nearby Homes
- 9654 N 18th St
- 9640 N 18th St Unit 8
- 9614 N 19th St
- 9424 N 17th Place
- 9417 N 17th Place
- 9935 N 16th Place E Unit 69
- 9429 N 19th St
- 9932 N 16th Place E
- 9711 N 15th Place
- 1514 E Turquoise Ave
- 1407 E Mountain View Rd
- 1543 E Mission Ln
- 10401 N Cave Creek Rd Unit 254
- 10401 N Cave Creek Rd Unit 235
- 10401 N Cave Creek Rd Unit 37
- 10401 N Cave Creek Rd Unit 324
- 10401 N Cave Creek Rd Unit 250
- 10401 N Cave Creek Rd Unit 131
- 10401 N Cave Creek Rd Unit 93
- 10401 N Cave Creek Rd Unit 58
- 1725 E Mountain View Rd
- 1713 E Mountain View Rd
- 1732 E Purdue Ave
- 1724 E Purdue Ave
- 1733 E Mountain View Rd
- 1707 E Mountain View Rd
- 1740 E Purdue Ave
- 1720 E Mountain View Rd
- 1718 E Purdue Ave Unit 8
- 1741 E Mountain View Rd
- 1701 E Mountain View Rd
- 1716 E Mountain View Rd
- 1726 E Mountain View Rd
- 1750 E Purdue Ave
- 9662 N 18th St
- 9820 N Turquoise Ave
- 9631 N 17th Place
- 9639 N 17th Place
- 9815 N 17th St
- 1734 E Mountain View Rd
Your Personal Tour Guide
Ask me questions while you tour the home.