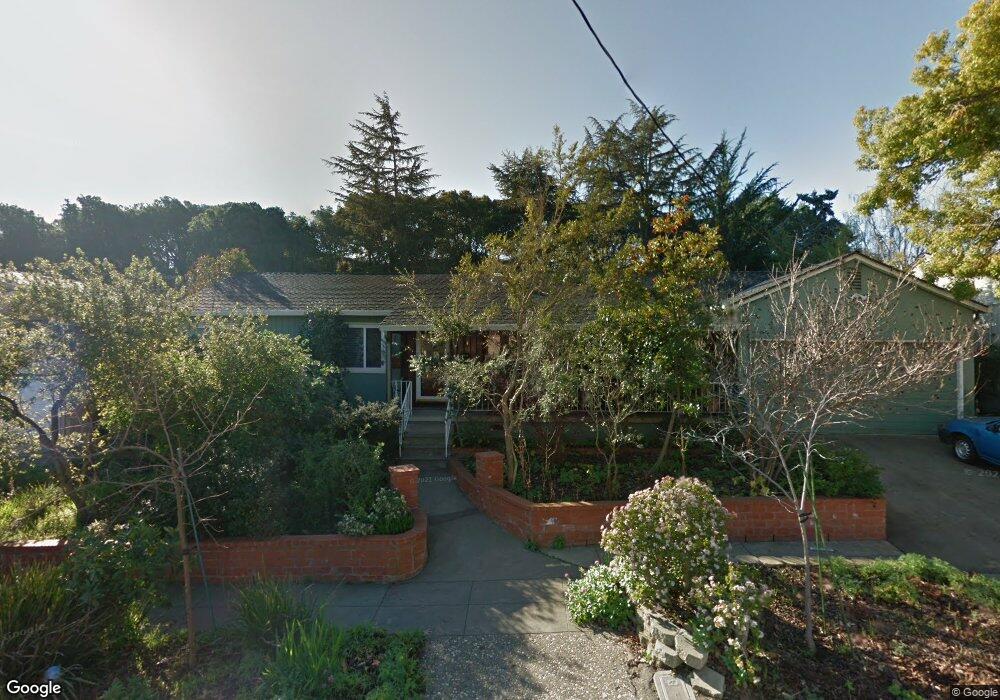
1719 Grove Way Castro Valley, CA 94546
South of 580 NeighborhoodEstimated Value: $936,000 - $1,058,000
3
Beds
3
Baths
1,674
Sq Ft
$598/Sq Ft
Est. Value
About This Home
This home is located at 1719 Grove Way, Castro Valley, CA 94546 and is currently estimated at $1,001,016, approximately $597 per square foot. 1719 Grove Way is a home located in Alameda County with nearby schools including Strobridge Elementary School, Fairview Elementary School, and Bret Harte Middle School.
Ownership History
Date
Name
Owned For
Owner Type
Purchase Details
Closed on
Jul 17, 1997
Sold by
Fishman Alan and Wah Anita
Bought by
Fishman Alan and Wah Anita
Current Estimated Value
Home Financials for this Owner
Home Financials are based on the most recent Mortgage that was taken out on this home.
Original Mortgage
$172,800
Outstanding Balance
$25,489
Interest Rate
7.83%
Estimated Equity
$975,527
Purchase Details
Closed on
Jul 9, 1997
Sold by
Navarro Daniel M and Navarro Jeanette E
Bought by
Fishman Alan M and Wah Anita
Home Financials for this Owner
Home Financials are based on the most recent Mortgage that was taken out on this home.
Original Mortgage
$172,800
Outstanding Balance
$25,489
Interest Rate
7.83%
Estimated Equity
$975,527
Purchase Details
Closed on
Sep 16, 1994
Sold by
Kennedy Richard and Nye Yvonne M
Bought by
Navarro Daniel M and Navarro Jeanette E
Home Financials for this Owner
Home Financials are based on the most recent Mortgage that was taken out on this home.
Original Mortgage
$151,600
Interest Rate
8.61%
Create a Home Valuation Report for This Property
The Home Valuation Report is an in-depth analysis detailing your home's value as well as a comparison with similar homes in the area
Home Values in the Area
Average Home Value in this Area
Purchase History
| Date | Buyer | Sale Price | Title Company |
|---|---|---|---|
| Fishman Alan | -- | None Available | |
| Fishman Alan M | $216,000 | North American Title Co | |
| Navarro Daniel M | $189,500 | North American Title Company |
Source: Public Records
Mortgage History
| Date | Status | Borrower | Loan Amount |
|---|---|---|---|
| Open | Fishman Alan M | $172,800 | |
| Previous Owner | Navarro Daniel M | $151,600 |
Source: Public Records
Tax History Compared to Growth
Tax History
| Year | Tax Paid | Tax Assessment Tax Assessment Total Assessment is a certain percentage of the fair market value that is determined by local assessors to be the total taxable value of land and additions on the property. | Land | Improvement |
|---|---|---|---|---|
| 2025 | $5,005 | $349,410 | $103,464 | $252,946 |
| 2024 | $5,005 | $342,422 | $101,435 | $247,987 |
| 2023 | $4,903 | $342,572 | $99,447 | $243,125 |
| 2022 | $4,784 | $328,856 | $97,497 | $238,359 |
| 2021 | $4,724 | $322,270 | $95,585 | $233,685 |
| 2020 | $4,658 | $325,896 | $94,606 | $231,290 |
| 2019 | $4,689 | $319,507 | $92,751 | $226,756 |
| 2018 | $4,414 | $313,244 | $90,933 | $222,311 |
| 2017 | $4,304 | $307,102 | $89,150 | $217,952 |
| 2016 | $4,054 | $301,082 | $87,402 | $213,680 |
| 2015 | $3,942 | $296,560 | $86,090 | $210,470 |
| 2014 | $3,728 | $290,751 | $84,403 | $206,348 |
Source: Public Records
Map
Nearby Homes
- 21314 Gary Dr Unit 214
- 21284 Tyee St
- 21259 Hobert St
- 21103 Gary Dr Unit 303
- 21239 Gary Dr Unit 317D
- 21239 Gary Dr Unit 316A
- 21235 Kahlert St
- 21062 Gary Dr Unit 313
- 22135 Sevilla Rd Unit 47
- 22103 Vista Del Plaza Ln Unit 15
- 22134 Orange Ave
- 21117 Gary Dr Unit 106
- 21117 Gary Dr Unit 105
- 21476 Orange Ave
- 21109 Gary Dr Unit 209
- 2270 Vestal Ave
- 1005 Imperial Place
- 20919 Locust St Unit K
- 22234 Prospect St
- 20998 Chester St
- 1713 Grove Way
- 1725 Grove Way
- 21620 Gail Dr
- 21626 Gail Dr
- 1731 Grove Way
- 1718 Grove Way
- 1707 Grove Way
- 21508 Gail Dr
- 1724 Grove Way
- 1712 Grove Way
- 21632 Gail Dr
- 1730 Grove Way
- 1737 Grove Way
- 21623 Shadyspring Rd
- 21638 Gail Dr
- 1736 Grove Way
- 21611 Shadyspring Rd
- 21507 Gail Dr
- 21611 Gail Dr
- 21501 Gail Dr