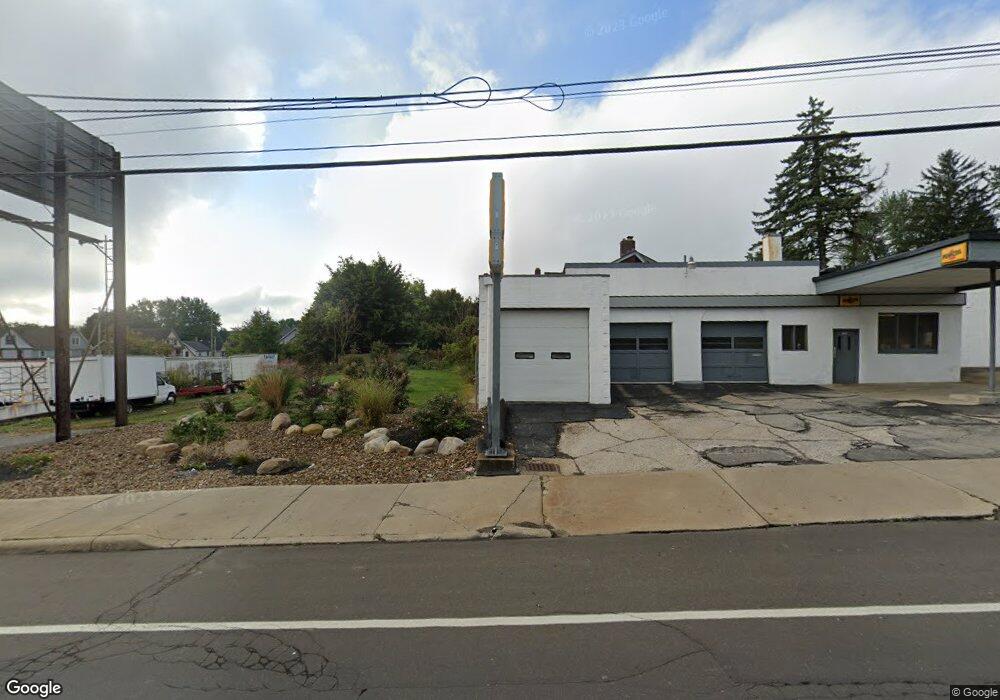
1719 Mahoning Ave Youngstown, OH 44509
Schenley NeighborhoodEstimated Value: $125,000
4
Beds
1
Bath
1,316
Sq Ft
$95/Sq Ft
Est. Value
About This Home
This home is located at 1719 Mahoning Ave, Youngstown, OH 44509 and is currently estimated at $125,000, approximately $94 per square foot. 1719 Mahoning Ave is a home located in Mahoning County with nearby schools including Kirkmere Elementary School, Chaney High School, and Summit Academy - Youngstown.
Ownership History
Date
Name
Owned For
Owner Type
Purchase Details
Closed on
Nov 23, 2021
Bought by
J Khoury Property Llc
Current Estimated Value
Purchase Details
Closed on
Sep 25, 2008
Sold by
Saxon Mortgage Services Inc
Bought by
Triune Enterprises L L C
Purchase Details
Closed on
Aug 28, 2008
Sold by
Saxon Mortgage Services Inc
Bought by
Deutsche Bank National Trust Company
Purchase Details
Closed on
Jul 30, 2008
Sold by
Boyd Nicole and Case #07Cv2028
Bought by
Saxon Mortgage Services Inc
Purchase Details
Closed on
Jul 26, 2004
Sold by
Homecomings Financial Network
Bought by
Millenium Enterprises Llc
Purchase Details
Closed on
Apr 13, 2004
Sold by
Nasser Nasser H H and Nasser Norman
Bought by
Homecomings Financial Network
Purchase Details
Closed on
Sep 19, 1997
Sold by
Walton Jerry D
Bought by
Nasser Mohammed H
Purchase Details
Closed on
Jun 12, 1989
Bought by
Walton Jerry D
Create a Home Valuation Report for This Property
The Home Valuation Report is an in-depth analysis detailing your home's value as well as a comparison with similar homes in the area
Home Values in the Area
Average Home Value in this Area
Purchase History
| Date | Buyer | Sale Price | Title Company |
|---|---|---|---|
| J Khoury Property Llc | -- | -- | |
| Triune Enterprises L L C | $6,500 | None Available | |
| Saxon Mortgage Services Inc | -- | None Available | |
| Deutsche Bank National Trust Company | -- | Attorney | |
| Saxon Mortgage Services Inc | $12,000 | None Available | |
| Millenium Enterprises Llc | $7,900 | -- | |
| Homecomings Financial Network | $10,000 | -- | |
| Nasser Mohammed H | $11,600 | -- | |
| Walton Jerry D | $16,000 | -- |
Source: Public Records
Tax History Compared to Growth
Tax History
| Year | Tax Paid | Tax Assessment Tax Assessment Total Assessment is a certain percentage of the fair market value that is determined by local assessors to be the total taxable value of land and additions on the property. | Land | Improvement |
|---|---|---|---|---|
| 2024 | $72 | $1,010 | $1,010 | -- |
| 2023 | $73 | $1,010 | $1,010 | $0 |
| 2022 | $86 | $1,080 | $1,080 | $0 |
| 2021 | $90 | $1,080 | $1,080 | $0 |
| 2020 | $90 | $1,080 | $1,080 | $0 |
| 2019 | $90 | $1,080 | $1,080 | $0 |
| 2018 | $199 | $1,080 | $1,080 | $0 |
| 2017 | $62 | $1,080 | $1,080 | $0 |
| 2016 | $629 | $4,930 | $1,680 | $3,250 |
| 2015 | $398 | $6,110 | $1,680 | $4,430 |
| 2014 | $395 | $6,110 | $1,680 | $4,430 |
| 2013 | $390 | $6,110 | $1,680 | $4,430 |
Source: Public Records
Map
Nearby Homes
- 15 S Portland Ave
- 1751 Mahoning Ave
- 60 Steel St
- 106 Steel St
- 1595 2nd St
- 77 Fernwood Ave
- 1594 2nd St
- 234 S Portland Ave
- 219 N Maryland Ave
- 112 Glacier Ave
- 1711 Wellington Ave
- 1611 Wellington Ave
- 134 Millet Ave
- 115 N Richview Ave
- 120 Whitney Ave S
- 1651 Price Rd
- 61 S Hartford Ave
- 1947 Manhattan Ave
- 28 N Hartford Ave
- 107 N Hartford Ave
- 1727 Mahoning Ave
- 17 S Portland Ave
- 16 S Lakeview Ave
- 20 S Lakeview Ave
- 1716 Mahoning Ave
- 22 S Lakeview Ave Unit 24
- 35 S Portland Ave
- 20 S Portland Ave
- 16 S Portland Ave
- 1697 Mahoning Ave
- 1693-1697 Mahoning Ave
- 1695 Mahoning Ave
- 28 S Lakeview Ave
- 1743 Mahoning Ave
- 1693 Mahoning Ave
- 1693 Mahoning Ave Unit 697
- 1693 Mahoning Ave Unit 9
- 39 S Portland Ave
- 1689 Mahoning Ave
- 15 N Portland Ave