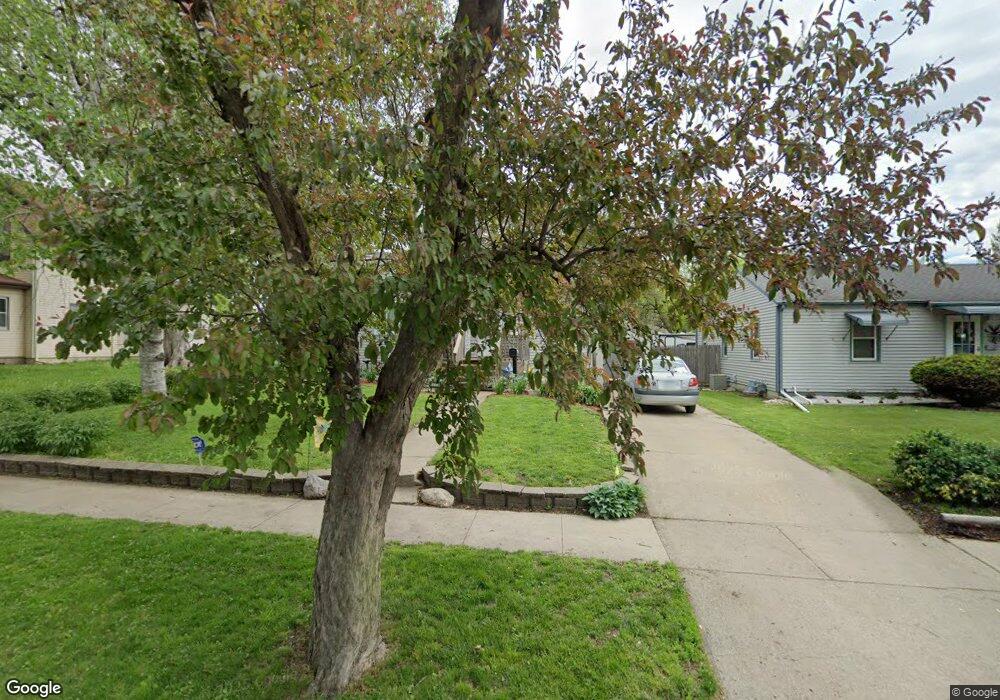
1719 Searle St Des Moines, IA 50317
Fairmont Park NeighborhoodEstimated Value: $123,000 - $155,000
2
Beds
1
Bath
744
Sq Ft
$188/Sq Ft
Est. Value
About This Home
This home is located at 1719 Searle St, Des Moines, IA 50317 and is currently estimated at $139,789, approximately $187 per square foot. 1719 Searle St is a home located in Polk County with nearby schools including Phillips Elementary, Goodrell Middle School, and North High School.
Ownership History
Date
Name
Owned For
Owner Type
Purchase Details
Closed on
Aug 30, 1999
Sold by
Wright Charles Wesley
Bought by
Siefken Kerry S and Casey Phoebe K
Current Estimated Value
Home Financials for this Owner
Home Financials are based on the most recent Mortgage that was taken out on this home.
Original Mortgage
$44,000
Outstanding Balance
$16,184
Interest Rate
11.25%
Estimated Equity
$123,605
Purchase Details
Closed on
Apr 15, 1997
Sold by
Wright Patricia Ann
Bought by
Wright Charles Wesley
Create a Home Valuation Report for This Property
The Home Valuation Report is an in-depth analysis detailing your home's value as well as a comparison with similar homes in the area
Home Values in the Area
Average Home Value in this Area
Purchase History
| Date | Buyer | Sale Price | Title Company |
|---|---|---|---|
| Siefken Kerry S | $65,500 | -- | |
| Wright Charles Wesley | -- | -- |
Source: Public Records
Mortgage History
| Date | Status | Borrower | Loan Amount |
|---|---|---|---|
| Open | Siefken Kerry S | $44,000 |
Source: Public Records
Tax History Compared to Growth
Tax History
| Year | Tax Paid | Tax Assessment Tax Assessment Total Assessment is a certain percentage of the fair market value that is determined by local assessors to be the total taxable value of land and additions on the property. | Land | Improvement |
|---|---|---|---|---|
| 2025 | $1,970 | $125,600 | $26,100 | $99,500 |
| 2024 | $1,970 | $110,600 | $22,600 | $88,000 |
| 2023 | $1,822 | $110,600 | $22,600 | $88,000 |
| 2022 | $1,806 | $86,200 | $17,900 | $68,300 |
| 2021 | $1,702 | $86,200 | $17,900 | $68,300 |
| 2020 | $1,762 | $76,800 | $15,800 | $61,000 |
| 2019 | $1,510 | $76,800 | $15,800 | $61,000 |
| 2018 | $1,490 | $64,700 | $13,100 | $51,600 |
| 2017 | $1,482 | $64,700 | $13,100 | $51,600 |
| 2016 | $1,438 | $63,300 | $12,600 | $50,700 |
| 2015 | $1,438 | $63,300 | $12,600 | $50,700 |
| 2014 | $1,326 | $60,700 | $11,900 | $48,800 |
Source: Public Records
Map
Nearby Homes
- 1614 Searle St
- 1603 Searle St
- 1901 E 23rd St
- 1915 E 22nd St
- 1740 E 21st St
- 2112 E 23rd St
- 1821 E 25th St
- 2208 Tichenor St
- 2216 Lay St
- 1415 Delaware Ave
- 1529 E 19th St
- 2324 E 23rd St
- 1404 E 19th St
- 1311 E 25th Ct
- 2710 E Washington Ave
- 1430 E 27th St
- 1531 Stewart St
- 1536 Stewart St
- 2707 Cleveland Ave
- 2729 Thompson Ave