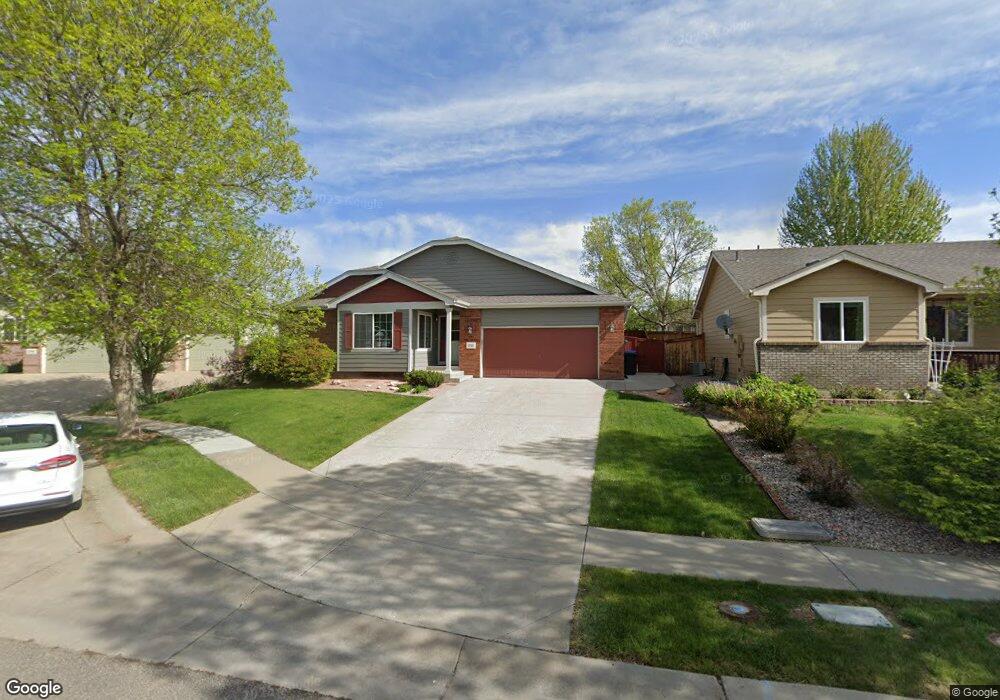
1719 Talc Place Loveland, CO 80537
Estimated Value: $496,000 - $603,000
3
Beds
2
Baths
1,447
Sq Ft
$377/Sq Ft
Est. Value
About This Home
This home is located at 1719 Talc Place, Loveland, CO 80537 and is currently estimated at $545,689, approximately $377 per square foot. 1719 Talc Place is a home located in Larimer County with nearby schools including Winona Elementary School, Peakview Academy at Conrad Ball, and Mountain View High School.
Ownership History
Date
Name
Owned For
Owner Type
Purchase Details
Closed on
Oct 2, 2020
Sold by
Gammie Donna L
Bought by
Pearson Maurice R and Pearson Irma I
Current Estimated Value
Home Financials for this Owner
Home Financials are based on the most recent Mortgage that was taken out on this home.
Original Mortgage
$329,037
Outstanding Balance
$292,661
Interest Rate
2.9%
Mortgage Type
VA
Estimated Equity
$253,028
Purchase Details
Closed on
Jul 29, 2003
Sold by
Rust Construction Inc
Bought by
Mccool Steven C
Home Financials for this Owner
Home Financials are based on the most recent Mortgage that was taken out on this home.
Original Mortgage
$225,930
Interest Rate
5.19%
Mortgage Type
VA
Purchase Details
Closed on
Oct 16, 2002
Sold by
Kraxberger Steven D
Bought by
Rust Construction Inc
Home Financials for this Owner
Home Financials are based on the most recent Mortgage that was taken out on this home.
Original Mortgage
$164,987
Interest Rate
5.89%
Mortgage Type
Construction
Create a Home Valuation Report for This Property
The Home Valuation Report is an in-depth analysis detailing your home's value as well as a comparison with similar homes in the area
Home Values in the Area
Average Home Value in this Area
Purchase History
| Date | Buyer | Sale Price | Title Company |
|---|---|---|---|
| Pearson Maurice R | $511,450 | First American | |
| Mccool Steven C | $221,500 | -- | |
| Rust Construction Inc | $65,405 | -- |
Source: Public Records
Mortgage History
| Date | Status | Borrower | Loan Amount |
|---|---|---|---|
| Open | Pearson Maurice R | $329,037 | |
| Previous Owner | Mccool Steven C | $225,930 | |
| Previous Owner | Rust Construction Inc | $164,987 |
Source: Public Records
Tax History Compared to Growth
Tax History
| Year | Tax Paid | Tax Assessment Tax Assessment Total Assessment is a certain percentage of the fair market value that is determined by local assessors to be the total taxable value of land and additions on the property. | Land | Improvement |
|---|---|---|---|---|
| 2025 | $2,576 | $35,959 | $8,509 | $27,450 |
| 2024 | $2,484 | $35,959 | $8,509 | $27,450 |
| 2022 | $2,185 | $27,459 | $4,684 | $22,775 |
| 2021 | $2,245 | $28,250 | $4,819 | $23,431 |
| 2020 | $2,272 | $28,578 | $4,819 | $23,759 |
| 2019 | $2,056 | $26,298 | $4,819 | $21,479 |
| 2018 | $1,720 | $20,895 | $4,853 | $16,042 |
| 2017 | $1,481 | $20,895 | $4,853 | $16,042 |
| 2016 | $1,402 | $19,112 | $5,365 | $13,747 |
| 2015 | $1,390 | $19,120 | $5,370 | $13,750 |
| 2014 | $1,183 | $15,730 | $5,370 | $10,360 |
Source: Public Records
Map
Nearby Homes
- 734 Blue Azurite Ave
- 770 Lavastone Ave
- 398 Blue Azurite Ave
- 393 Lavastone Ave
- 1502 E 5th St
- 1343 E 7th St Unit 1
- 1812 E 11th St
- 1335 E 7th St
- 1947 Virgo Cir
- 1326 E 8th St
- 732 Madison Ave
- 947 Delphinus Place
- 332 Madison Ave
- 1843 Gemini Ct
- 1510 E 1st St
- 1726 Garnet St Unit 126
- 1850 Sandstone Ct Unit 84
- 1700 Pearl Dr Unit 106
- 1234 Limestone Ave Unit 97
- 1641 Garnet St Unit 49
- 1737 Talc Place
- 1701 Talc Place
- 1730 E 7th St
- 1714 E 7th St
- 1746 E 7th St
- 635 Flint Ave
- 1698 E 7th St
- 1724 Talc Place
- 609 Flint Ave
- 1746 Talc Place
- 1755 Talc Place
- 1682 E 7th St
- 1762 E 7th St
- 660 Blue Azurite Ave
- 644 Blue Azurite Ave
- 1750 Talc Place
- 583 Flint Ave
- 1773 Talc Place
- 628 Blue Azurite Ave
- 1739 E 7th St