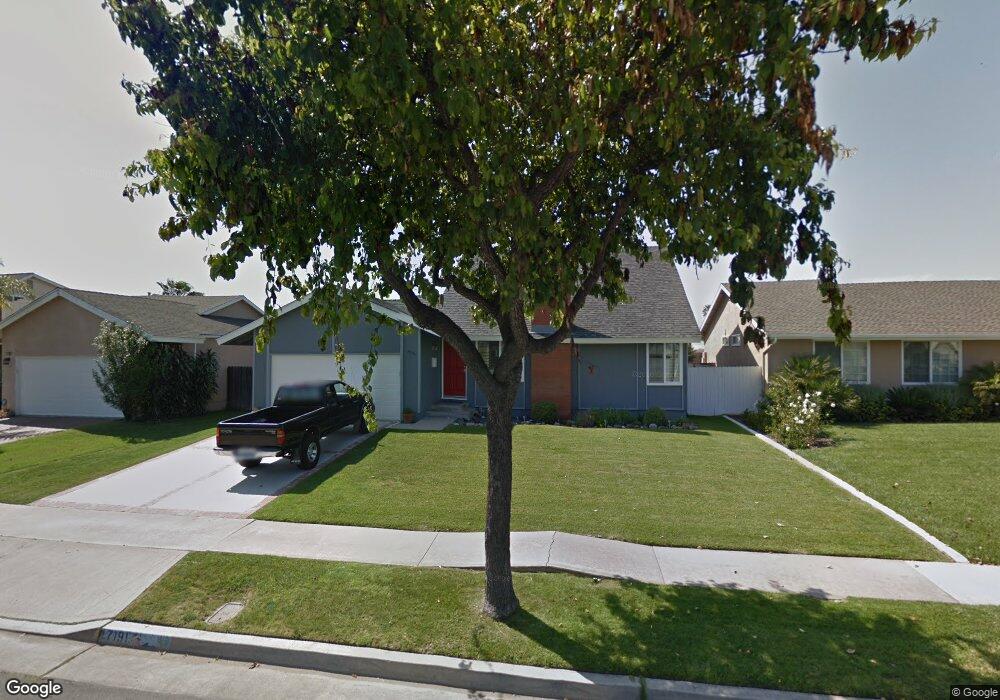
17191 Apel Ln Huntington Beach, CA 92649
Estimated Value: $1,300,727 - $1,391,000
3
Beds
2
Baths
1,386
Sq Ft
$981/Sq Ft
Est. Value
About This Home
This home is located at 17191 Apel Ln, Huntington Beach, CA 92649 and is currently estimated at $1,359,432, approximately $980 per square foot. 17191 Apel Ln is a home located in Orange County with nearby schools including Hope View Elementary School, Marine View Middle, and Huntington Beach High School.
Ownership History
Date
Name
Owned For
Owner Type
Purchase Details
Closed on
Oct 24, 2018
Sold by
Kelly Rowan B
Bought by
Kelly Rowan B
Current Estimated Value
Home Financials for this Owner
Home Financials are based on the most recent Mortgage that was taken out on this home.
Interest Rate
4.85%
Purchase Details
Closed on
May 14, 2010
Sold by
King Helen Lisle
Bought by
Kelly Rowan B and Pugh Kristen L
Home Financials for this Owner
Home Financials are based on the most recent Mortgage that was taken out on this home.
Original Mortgage
$410,000
Interest Rate
4.91%
Mortgage Type
New Conventional
Purchase Details
Closed on
Aug 18, 2006
Sold by
King Mary Scott
Bought by
The Mary Scott King Living Trust
Purchase Details
Closed on
Aug 21, 1998
Sold by
Hideo Shimoda and Hideo Myrtle Shimoda
Bought by
King Mary Scott
Home Financials for this Owner
Home Financials are based on the most recent Mortgage that was taken out on this home.
Original Mortgage
$265,050
Interest Rate
6.88%
Create a Home Valuation Report for This Property
The Home Valuation Report is an in-depth analysis detailing your home's value as well as a comparison with similar homes in the area
Home Values in the Area
Average Home Value in this Area
Purchase History
| Date | Buyer | Sale Price | Title Company |
|---|---|---|---|
| Kelly Rowan B | -- | -- | |
| Kelly Rowan B | $610,000 | -- | |
| The Mary Scott King Living Trust | -- | None Available | |
| King Mary Scott | $279,000 | American Title |
Source: Public Records
Mortgage History
| Date | Status | Borrower | Loan Amount |
|---|---|---|---|
| Closed | Kelly Rowan B | -- | |
| Previous Owner | Kelly Rowan B | $410,000 | |
| Previous Owner | King Mary Scott | $265,050 |
Source: Public Records
Tax History Compared to Growth
Tax History
| Year | Tax Paid | Tax Assessment Tax Assessment Total Assessment is a certain percentage of the fair market value that is determined by local assessors to be the total taxable value of land and additions on the property. | Land | Improvement |
|---|---|---|---|---|
| 2025 | $8,769 | $787,394 | $698,473 | $88,921 |
| 2024 | $8,769 | $771,955 | $684,777 | $87,178 |
| 2023 | $8,571 | $756,819 | $671,350 | $85,469 |
| 2022 | $8,445 | $741,980 | $658,186 | $83,794 |
| 2021 | $8,289 | $727,432 | $645,281 | $82,151 |
| 2020 | $8,196 | $719,974 | $638,665 | $81,309 |
| 2019 | $8,051 | $705,857 | $626,142 | $79,715 |
| 2018 | $7,869 | $692,017 | $613,865 | $78,152 |
| 2017 | $7,742 | $678,449 | $601,829 | $76,620 |
| 2016 | $7,421 | $665,147 | $590,029 | $75,118 |
| 2015 | $7,308 | $655,156 | $581,166 | $73,990 |
| 2014 | $7,164 | $642,323 | $569,782 | $72,541 |
Source: Public Records
Map
Nearby Homes
- 17372 Forbes Ln
- 17042 Twain Ln
- 17352 Eucalyptus Ln
- 6051 Summerdale Dr
- 17532 Montbury Cir
- 17071 Pinehurst Ln
- 17231 Lido Ln
- 5262 Glenroy Dr
- 5241 Glenroy Dr
- 5812 Raphael Dr
- 5862 Raphael Dr
- 17202 Corbina Ln Unit 108
- 6301 Warner Ave Unit 40
- 6301 Warner Ave Unit 88
- 17191 Corbina Ln Unit 110
- 16652 Busby Ln
- 16542 Los Verdes Ln
- 5591 Heil Ave
- 16832 Roosevelt Ln
- 6600 Warner Ave Unit 50