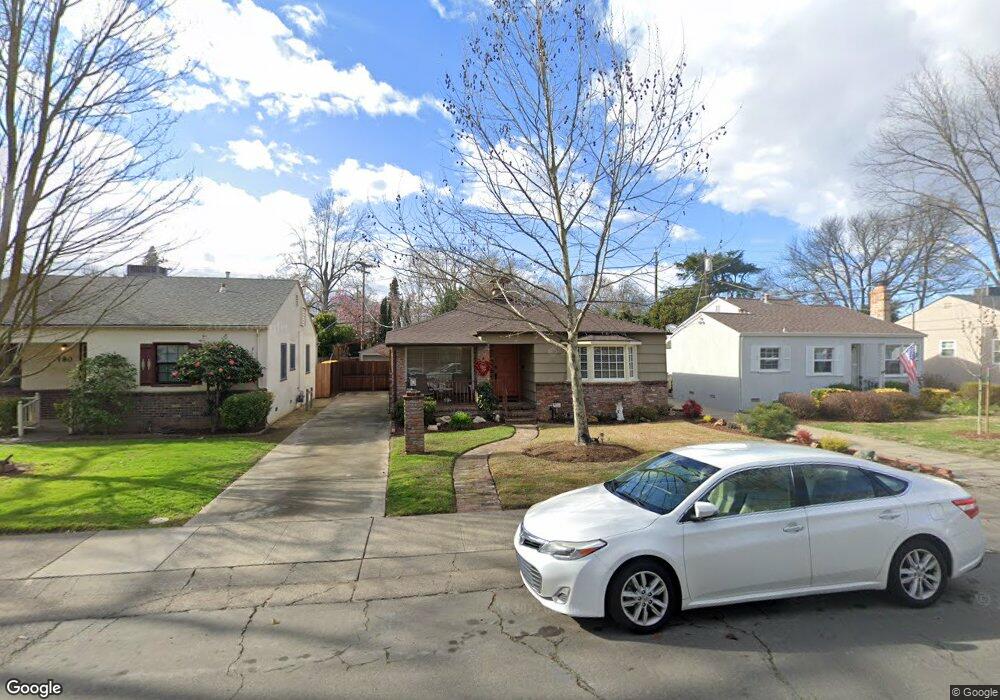
172 41st St Sacramento, CA 95819
East Sacramento NeighborhoodEstimated Value: $697,978 - $842,000
2
Beds
2
Baths
2,297
Sq Ft
$336/Sq Ft
Est. Value
About This Home
This home is located at 172 41st St, Sacramento, CA 95819 and is currently estimated at $770,995, approximately $335 per square foot. 172 41st St is a home located in Sacramento County with nearby schools including Theodore Judah Elementary, Miwok Middle School, and Hiram W. Johnson High School.
Ownership History
Date
Name
Owned For
Owner Type
Purchase Details
Closed on
Jun 16, 2011
Sold by
Manning Kevin Ray and Manning Pauline Ethel
Bought by
Manning Kevin R and Manning Pauline E
Current Estimated Value
Purchase Details
Closed on
Jan 9, 2009
Sold by
Manning Kevin and Manning Family Revocable House
Bought by
Manning Kevin Ray and Manning Pauline Ethel
Purchase Details
Closed on
Jun 2, 2006
Sold by
Manning Mary Pauline
Bought by
The Manning Family Revocable House Trust
Create a Home Valuation Report for This Property
The Home Valuation Report is an in-depth analysis detailing your home's value as well as a comparison with similar homes in the area
Home Values in the Area
Average Home Value in this Area
Purchase History
| Date | Buyer | Sale Price | Title Company |
|---|---|---|---|
| Manning Kevin R | -- | None Available | |
| Manning Kevin Ray | -- | None Available | |
| The Manning Family Revocable House Trust | -- | None Available |
Source: Public Records
Tax History
| Year | Tax Paid | Tax Assessment Tax Assessment Total Assessment is a certain percentage of the fair market value that is determined by local assessors to be the total taxable value of land and additions on the property. | Land | Improvement |
|---|---|---|---|---|
| 2025 | $1,355 | $101,506 | $16,493 | $85,013 |
| 2024 | $1,355 | $99,517 | $16,170 | $83,347 |
| 2023 | $1,323 | $97,566 | $15,853 | $81,713 |
| 2022 | $1,299 | $95,654 | $15,543 | $80,111 |
| 2021 | $1,242 | $93,780 | $15,239 | $78,541 |
| 2020 | $1,246 | $92,819 | $15,083 | $77,736 |
| 2019 | $1,220 | $91,000 | $14,788 | $76,212 |
| 2018 | $1,189 | $89,217 | $14,499 | $74,718 |
| 2017 | $1,172 | $87,468 | $14,215 | $73,253 |
| 2016 | $1,093 | $85,754 | $13,937 | $71,817 |
| 2015 | $1,049 | $84,467 | $13,728 | $70,739 |
| 2014 | $1,023 | $82,814 | $13,460 | $69,354 |
Source: Public Records
Map
Nearby Homes
Your Personal Tour Guide
Ask me questions while you tour the home.