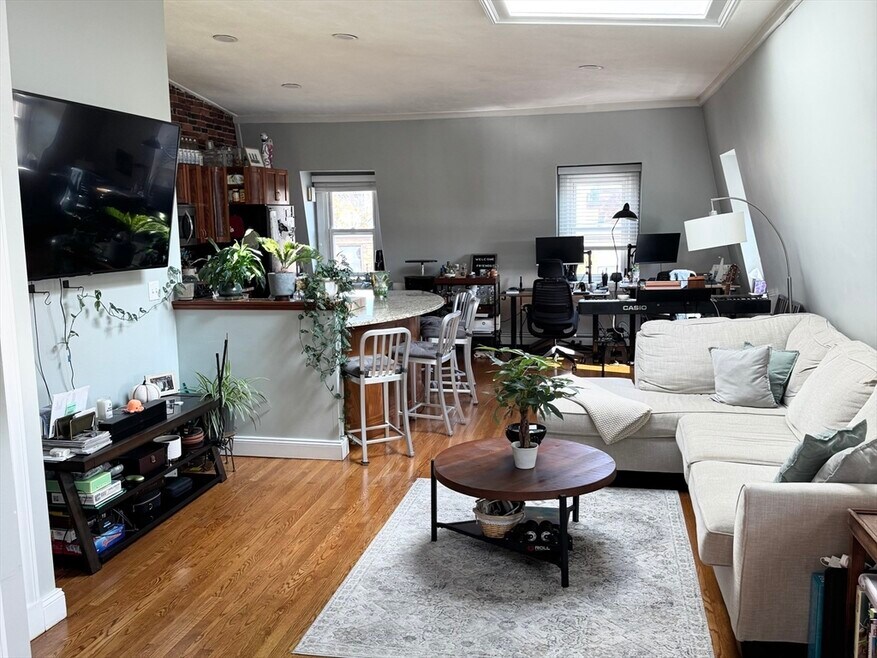
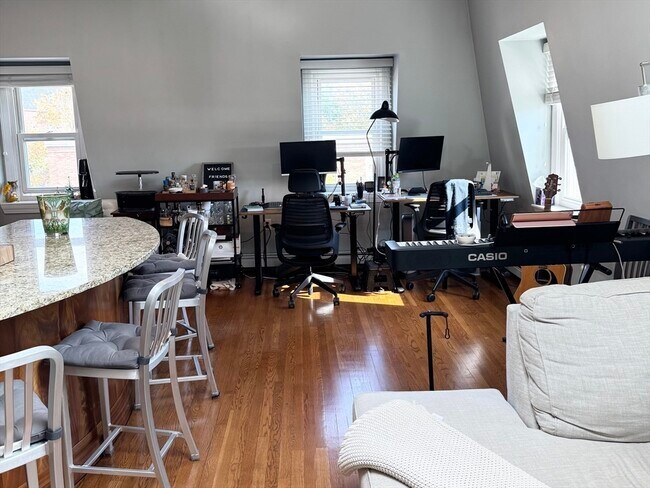
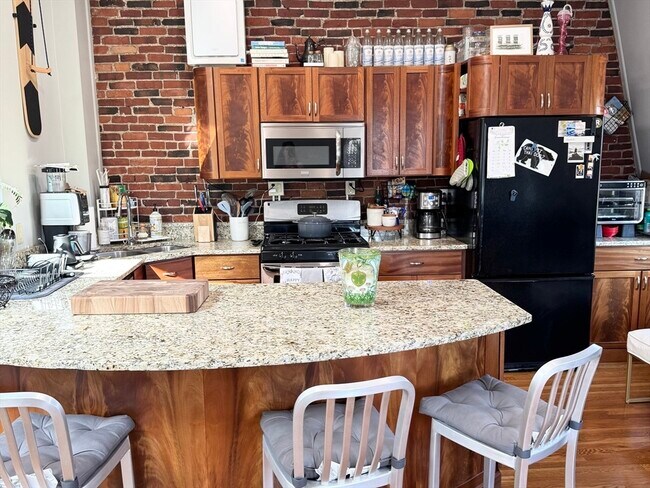
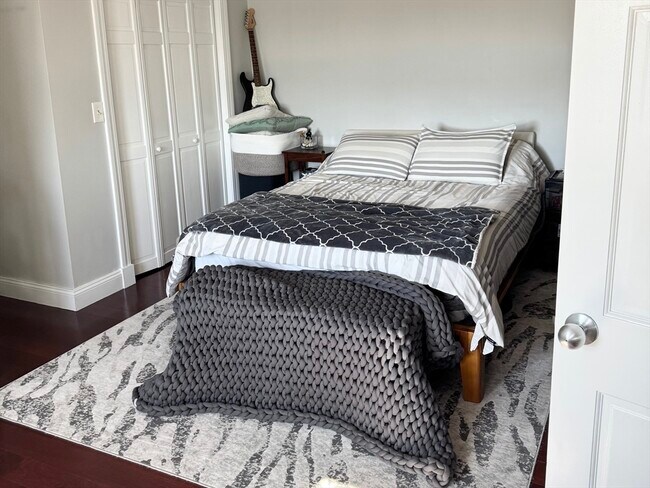
NOT LISTED FOR SALE

Estimated Value: $637,000 - $758,000

2 Beds
1 Bath
825 Sq Ft
$844/Sq Ft Est. Value

About This Home

This home is located at 172 Bunker Hill St Unit 2, Charlestown, MA 02129 and is currently estimated at $696,656, approximately $844 per square foot. 172 Bunker Hill St Unit 2 is a home located in Suffolk County with nearby schools including Boston Children's School and St John School.

Ownership History

Date Name Owned For Owner Type

Purchase Details

Closed on
Jun 30, 2010
Sold by
Bunker Hill Condo
Bought by
Estrada Karin N
Current Estimated Value
$696,656

Home Financials for this Owner

Home Financials are based on the most recent Mortgage that was taken out on this home.
Original Mortgage
$275,292
Interest Rate
4.88%
Mortgage Type
Purchase Money Mortgage

Purchase Details

Closed on
Mar 15, 2006
Sold by
Melchoinda Patricia M
Bought by
Grant Vincent

Purchase Details

Closed on
Oct 4, 2004
Sold by
Melchionda Patricia M and Grant Patricia
Bought by
Grant Vincent and Grant Patricia

Purchase Details

Closed on
Oct 2, 1996
Sold by
Fox Margaret K
Bought by
Melchionda Patricia M

Home Financials for this Owner

Home Financials are based on the most recent Mortgage that was taken out on this home.
Original Mortgage
$94,800
Interest Rate
7.9%
Mortgage Type
Purchase Money Mortgage
Source: Public Records

Range of Values:

Collateral Analytics

Collateral Analytics Collateral Analytics AVMs (Automated Valuation Model) employ a number of statistical approaches combined with neighborhood-specific comparable selection guarantees the most up-to-date and precise valuations.

Not Available

Collateral Analytics does not have data for the current month. Please view the chart for historical values.

ICE

ICE Mortgage Technology ICE Mortgage Technology’s AVM (Automated Valuation Model) is a state-of-the-art online residential property valuation tool that provides a quick and accurate estimate of the value of almost any home in the U.S.

Not Available

ICE Mortgage Technology does not have data for the current month. Please view the chart for historical values.

First American

First American First American Data & Analytics’ next-generation AVM combines unrivaled data assets with a blended ensemble of valuation models to produce highly accurate, reliable valuations you can trust.

Not Available

First American does not have data for the current month. Please view the chart for historical values.

Quantarium

Quantarium Quantarium’s valuation service, repeatedly proven the industry’s most accurate and comprehensive, is supercharged with a self-learning and auto-tuning AI engine that continually becomes smarter and more accurate as it processes daily inputs from the industry’s leading RE data lake.

Not Available

Quantarium does not have data for the current month. Please view the chart for historical values.

Average Value
Not Available
List Price
Sold Price
Create a Home Valuation Report for This Property
The Home Valuation Report is an in-depth analysis detailing your home's value as well as a comparison with similar homes in the area

Home Values in the Area

Source: Public Records

Average Home Value in this Area


Source: Public Records

Purchase History

Date Buyer Sale Price Title Company
Estrada Karin N $279,000 --
Grant Vincent -- --
Grant Vincent -- --
Melchionda Patricia M $118,500 --
Source: Public Records

Mortgage History

Date Status Borrower Loan Amount
Open Estrada Karin N $335,000
Closed Estrada Karin N $246,344
Closed Estrada Karin N $275,292
Previous Owner Grant Vincent $10,000
Previous Owner Melchionda Patricia M $94,800
Source: Public Records

Tax History Compared to Growth

Source: Public Records

Tax History

Year Tax Paid Tax Assessment Tax Assessment Total Assessment is a certain percentage of the fair market value that is determined by local assessors to be the total taxable value of land and additions on the property. Land Improvement
2025 $6,221 $537,200 $0 $537,200
2024 $5,805 $532,600 $0 $532,600
2023 $5,549 $516,700 $0 $516,700
2022 $5,405 $496,800 $0 $496,800
2021 $5,301 $496,800 $0 $496,800
2020 $4,708 $445,800 $0 $445,800
2019 $4,196 $398,100 $0 $398,100
2018 $3,972 $379,000 $0 $379,000
2017 $3,860 $364,500 $0 $364,500
2016 $3,892 $353,800 $0 $353,800
2015 $3,732 $308,200 $0 $308,200
2014 $3,555 $282,600 $0 $282,600
Source: Public Records

Map