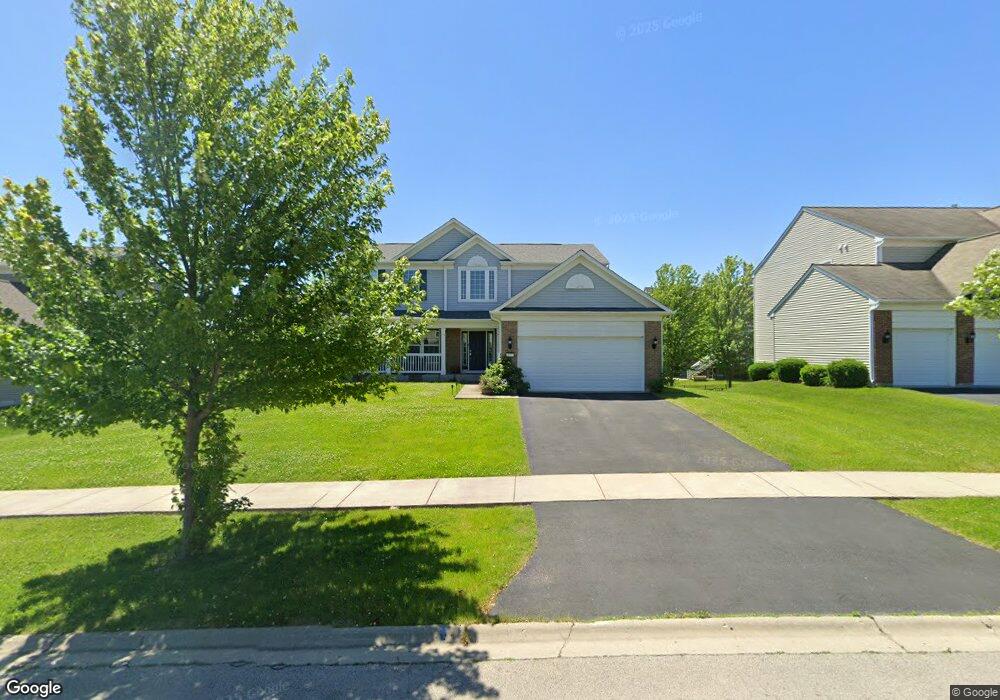
172 Chapin Way Oswego, IL 60543
North Oswego NeighborhoodEstimated Value: $502,987 - $574,000
4
Beds
3
Baths
2,415
Sq Ft
$217/Sq Ft
Est. Value
About This Home
This home is located at 172 Chapin Way, Oswego, IL 60543 and is currently estimated at $523,247, approximately $216 per square foot. 172 Chapin Way is a home located in Kendall County with nearby schools including Southbury Elementary School, Murphy Junior High School, and Oswego East High School.
Ownership History
Date
Name
Owned For
Owner Type
Purchase Details
Closed on
Sep 13, 2011
Sold by
Pulte Home Corporation
Bought by
Orteza Deofil A
Current Estimated Value
Home Financials for this Owner
Home Financials are based on the most recent Mortgage that was taken out on this home.
Original Mortgage
$264,865
Outstanding Balance
$181,291
Interest Rate
4.25%
Mortgage Type
FHA
Estimated Equity
$341,956
Create a Home Valuation Report for This Property
The Home Valuation Report is an in-depth analysis detailing your home's value as well as a comparison with similar homes in the area
Home Values in the Area
Average Home Value in this Area
Purchase History
| Date | Buyer | Sale Price | Title Company |
|---|---|---|---|
| Orteza Deofil A | $272,000 | None Available |
Source: Public Records
Mortgage History
| Date | Status | Borrower | Loan Amount |
|---|---|---|---|
| Open | Orteza Deofil A | $264,865 |
Source: Public Records
Tax History Compared to Growth
Tax History
| Year | Tax Paid | Tax Assessment Tax Assessment Total Assessment is a certain percentage of the fair market value that is determined by local assessors to be the total taxable value of land and additions on the property. | Land | Improvement |
|---|---|---|---|---|
| 2024 | $11,050 | $143,319 | $27,124 | $116,195 |
| 2023 | $9,779 | $125,718 | $23,793 | $101,925 |
| 2022 | $9,779 | $114,289 | $21,630 | $92,659 |
| 2021 | $9,721 | $109,893 | $20,798 | $89,095 |
| 2020 | $9,417 | $105,666 | $19,998 | $85,668 |
| 2019 | $9,175 | $101,587 | $19,998 | $81,589 |
| 2018 | $9,445 | $100,046 | $26,928 | $73,118 |
| 2017 | $9,489 | $98,567 | $26,530 | $72,037 |
| 2016 | $9,329 | $95,696 | $25,757 | $69,939 |
| 2015 | $9,102 | $89,436 | $24,072 | $65,364 |
| 2014 | -- | $85,996 | $23,146 | $62,850 |
| 2013 | -- | $86,865 | $23,380 | $63,485 |
Source: Public Records
Map
Nearby Homes
- 154 Chapin Way
- 320 Ellis St
- 115 Henderson St
- 413 Hathaway Ln
- 417 Hathaway Ln
- 120 Henderson St
- 357 Danforth Dr
- 415 Hathaway Ln
- 145 Henderson St
- 419 Hathaway Ln
- 126 Henderson St
- 342 Danforth Dr
- Meadowlark Plan at Hudson Pointe - II - Horizon Series
- Starling Plan at Hudson Pointe - II - Horizon Series
- Townsend Plan at Hudson Pointe - II - Horizon Series
- Marianne Plan at Hudson Pointe - II - Townhome Series
- Darcy Plan at Hudson Pointe - II - Townhome Series
- Charlotte Plan at Hudson Pointe - II - Townhome Series
- Brighton Plan at Hudson Pointe - II - Horizon Series
- Hawthorne Plan at Hudson Pointe - II - Horizon Series