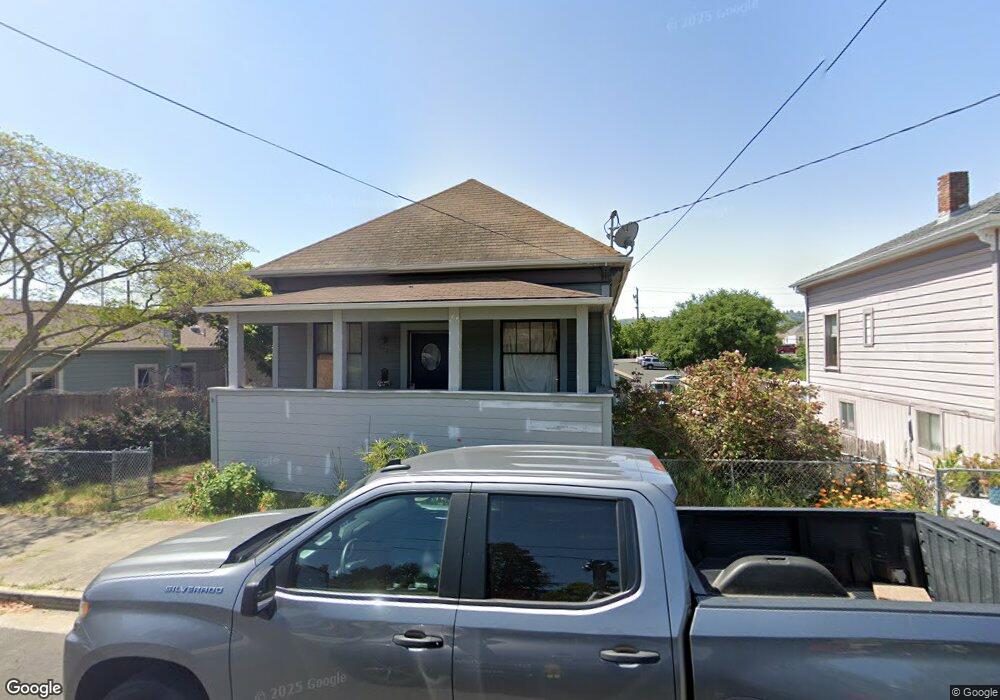
172 E I St Benicia, CA 94510
Estimated Value: $631,754 - $887,000
3
Beds
1
Bath
1,372
Sq Ft
$543/Sq Ft
Est. Value
About This Home
This home is located at 172 E I St, Benicia, CA 94510 and is currently estimated at $745,439, approximately $543 per square foot. 172 E I St is a home located in Solano County with nearby schools including Mary Farmar Elementary School, Benicia Middle School, and Benicia High School.
Ownership History
Date
Name
Owned For
Owner Type
Purchase Details
Closed on
Apr 16, 2024
Sold by
Carl Richard W
Bought by
Richard W Carl Family Trust and Carl
Current Estimated Value
Purchase Details
Closed on
Aug 20, 2021
Sold by
Carl Richard W
Bought by
Carl Richard W and Carl Desmond
Purchase Details
Closed on
Nov 25, 2013
Sold by
The Edward D Sheetz Trust and Carl Lois A
Bought by
Carl Lois A
Purchase Details
Closed on
Mar 19, 1992
Sold by
Sheetz Edward D
Bought by
Sheetz Edward D and Edward D Sheetz Trust
Create a Home Valuation Report for This Property
The Home Valuation Report is an in-depth analysis detailing your home's value as well as a comparison with similar homes in the area
Home Values in the Area
Average Home Value in this Area
Purchase History
| Date | Buyer | Sale Price | Title Company |
|---|---|---|---|
| Richard W Carl Family Trust | -- | None Listed On Document | |
| Carl Richard W | -- | None Listed On Document | |
| Carl Richard W | -- | None Available | |
| Carl Lois A | -- | None Available | |
| Sheetz Edward D | -- | -- |
Source: Public Records
Tax History
| Year | Tax Paid | Tax Assessment Tax Assessment Total Assessment is a certain percentage of the fair market value that is determined by local assessors to be the total taxable value of land and additions on the property. | Land | Improvement |
|---|---|---|---|---|
| 2025 | $656 | $55,025 | $14,077 | $40,948 |
| 2024 | $656 | $53,947 | $13,801 | $40,146 |
| 2023 | $640 | $52,890 | $13,531 | $39,359 |
| 2022 | $629 | $51,854 | $13,267 | $38,587 |
| 2021 | $616 | $50,838 | $13,007 | $37,831 |
| 2020 | $608 | $50,318 | $12,874 | $37,444 |
| 2019 | $598 | $49,332 | $12,622 | $36,710 |
| 2018 | $4,451 | $376,090 | $137,446 | $238,644 |
| 2017 | $570 | $47,419 | $12,133 | $35,286 |
| 2016 | $564 | $46,491 | $11,896 | $34,595 |
| 2015 | $549 | $45,794 | $11,718 | $34,076 |
| 2014 | $543 | $44,898 | $11,489 | $33,409 |
Source: Public Records
Map
Nearby Homes
Your Personal Tour Guide
Ask me questions while you tour the home.