Estimated Value: $261,240 - $283,000
3
Beds
2
Baths
1,802
Sq Ft
$150/Sq Ft
Est. Value
About This Home
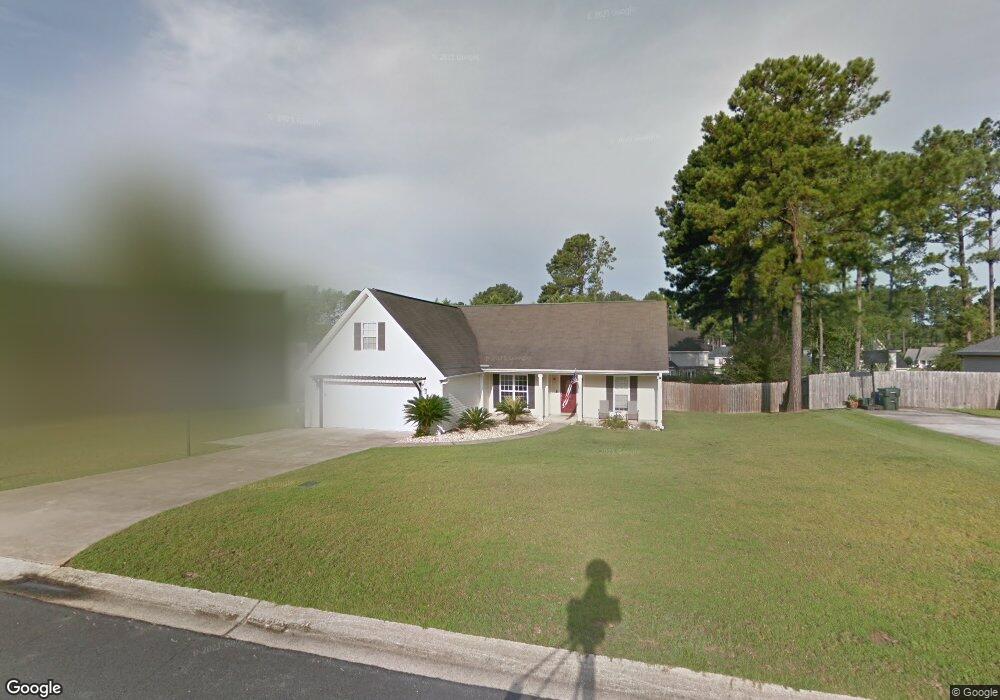
This home is located at 172 Gleneagle Dr, Byron, GA 31008 and is currently estimated at $270,560, approximately $150 per square foot. 172 Gleneagle Dr is a home located in Houston County with nearby schools including Eagle Springs Elementary School, Thomson Middle School, and Northside High School.
Ownership History
Date
Name
Owned For
Owner Type
Purchase Details
Closed on
Jul 8, 2019
Sold by
Moyers Kai Hilmar
Bought by
Ott Brandon S
Current Estimated Value
Home Financials for this Owner
Home Financials are based on the most recent Mortgage that was taken out on this home.
Original Mortgage
$174,060
Outstanding Balance
$152,742
Interest Rate
3.9%
Mortgage Type
VA
Estimated Equity
$117,818
Purchase Details
Closed on
Sep 13, 2013
Sold by
Moyers John R
Bought by
Moyers Kei H
Purchase Details
Closed on
Sep 15, 2005
Sold by
Magouirk David B and Magouirk Jennifer M
Bought by
Moyers John R
Purchase Details
Closed on
May 28, 2003
Sold by
Gardner Construction Co
Bought by
Magouirk David B and Magouirk Jennifer M
Purchase Details
Closed on
Mar 7, 2002
Sold by
Brewer Gary D
Bought by
Gardner Construction Co
Purchase Details
Closed on
Feb 17, 2000
Sold by
Garrard Steven Gary
Bought by
Brewer Gary D
Purchase Details
Closed on
Apr 20, 1999
Sold by
Wexford Plantation Inc
Bought by
Garrard Steven Gary
Create a Home Valuation Report for This Property
The Home Valuation Report is an in-depth analysis detailing your home's value as well as a comparison with similar homes in the area
Home Values in the Area
Average Home Value in this Area
Purchase History
| Date | Buyer | Sale Price | Title Company |
|---|---|---|---|
| Ott Brandon S | $168,500 | None Available | |
| Moyers Kei H | -- | -- | |
| Moyers John R | $145,500 | -- | |
| Magouirk David B | $135,200 | -- | |
| Gardner Construction Co | $16,700 | -- | |
| Brewer Gary D | $16,000 | -- | |
| Garrard Steven Gary | -- | -- |
Source: Public Records
Mortgage History
| Date | Status | Borrower | Loan Amount |
|---|---|---|---|
| Open | Ott Brandon S | $174,060 |
Source: Public Records
Tax History
| Year | Tax Paid | Tax Assessment Tax Assessment Total Assessment is a certain percentage of the fair market value that is determined by local assessors to be the total taxable value of land and additions on the property. | Land | Improvement |
|---|---|---|---|---|
| 2024 | $2,110 | $88,200 | $12,000 | $76,200 |
| 2023 | $1,683 | $69,640 | $10,000 | $59,640 |
| 2022 | $1,589 | $65,760 | $10,000 | $55,760 |
| 2021 | $1,488 | $61,240 | $10,000 | $51,240 |
| 2020 | $1,329 | $54,440 | $6,400 | $48,040 |
| 2019 | $1,329 | $54,440 | $6,400 | $48,040 |
| 2018 | $1,329 | $54,440 | $6,400 | $48,040 |
| 2017 | $1,330 | $54,440 | $6,400 | $48,040 |
| 2016 | $1,332 | $54,440 | $6,400 | $48,040 |
| 2015 | $1,335 | $54,440 | $6,400 | $48,040 |
| 2014 | -- | $54,440 | $6,400 | $48,040 |
| 2013 | -- | $54,200 | $6,400 | $47,800 |
Source: Public Records
Map
Nearby Homes
- 177 Gleneagle Dr
- 207 Gleneagle Dr
- 184 Amelia Dr
- 108 Amelia Dr
- 118 Bulloch Ct
- 119 Bulloch Ct
- 706 Georgian Walk
- 721 Georgian Walk
- 732 Georgian Walk
- 110 Bulloch Ct
- 221 Hanover Dr
- 108 Chatham Ct
- 108 Manchester Ln
- 107 Monroe Ct
- 503 Georgian Walk
- 109 Belfair Dr
- 205 White Rd
- 100 Monroe Ct
- 508 Georgian Walk
- 102 Monroe Ct
- 170 Gleneagle Dr
- 174 Gleneagle Dr
- 106 Dundee Pass
- 108 Dundee Pass
- 104 Dundee Pass
- 168 Gleneagle Dr
- 100 Dundee Pass
- 173 Gleneagle Dr
- 110 Dundee Pass
- 175 Gleneagle Dr
- 171 Gleneagle Dr
- 169 Gleneagle Dr
- 166 Gleneagle Dr
- 112 Dundee Pass
- 179 Gleneagle Dr
- 167 Gleneagle Dr
- 107 Dundee Pass
- 0 Dundee Pass
- 105 Dundee Pass
- 109 Dundee Pass
Your Personal Tour Guide
Ask me questions while you tour the home.