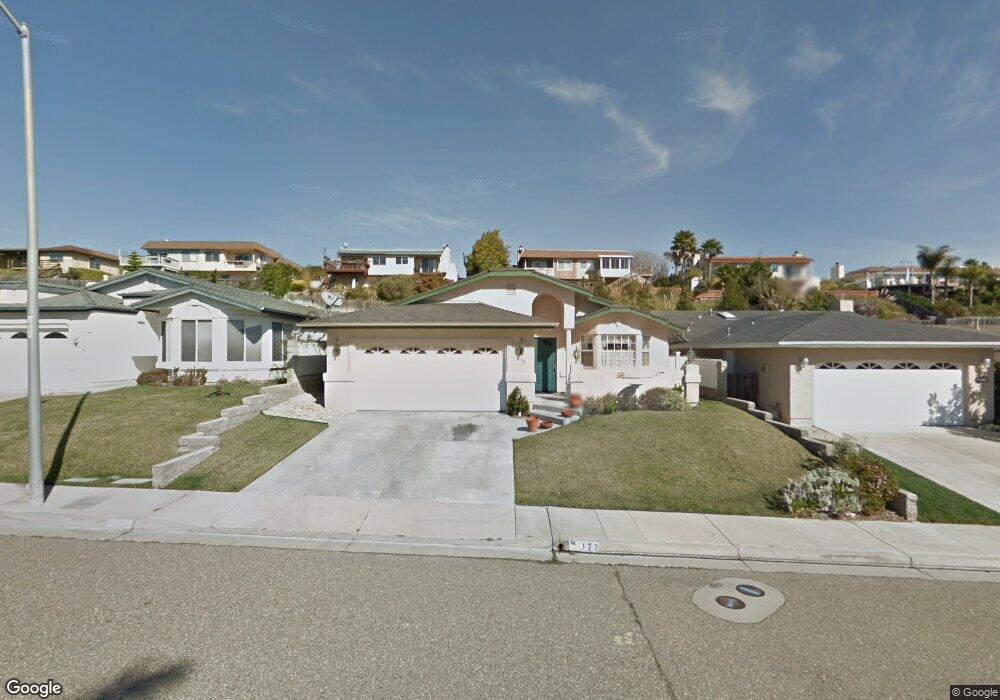
172 Irish Way Unit LOT Pismo Beach, CA 93449
Estimated Value: $1,001,978 - $1,098,000
3
Beds
2
Baths
1,500
Sq Ft
$698/Sq Ft
Est. Value
About This Home
This home is located at 172 Irish Way Unit LOT, Pismo Beach, CA 93449 and is currently estimated at $1,046,495, approximately $697 per square foot. 172 Irish Way Unit LOT is a home located in San Luis Obispo County with nearby schools including Judkins Middle School, Arroyo Grande High School, and Coastal Christian School.
Ownership History
Date
Name
Owned For
Owner Type
Purchase Details
Closed on
Sep 8, 2020
Sold by
John Cusano
Bought by
Johnson Alicia Lee and Johnson Johnny Stanley
Current Estimated Value
Purchase Details
Closed on
Feb 1, 2007
Sold by
Cusano Joyce and Cusano John
Bought by
Cusano John and Cusano Joyce
Home Financials for this Owner
Home Financials are based on the most recent Mortgage that was taken out on this home.
Original Mortgage
$544,185
Interest Rate
6.6%
Mortgage Type
Reverse Mortgage Home Equity Conversion Mortgage
Purchase Details
Closed on
May 20, 2003
Sold by
Cusano John
Bought by
Cusano John and Rivers Joyce
Purchase Details
Closed on
Feb 13, 1998
Sold by
Rivers Joyce R
Bought by
Cusano John
Purchase Details
Closed on
Oct 4, 1996
Sold by
Roscamp Earl
Bought by
Cusano John and Rivers Joyce A
Create a Home Valuation Report for This Property
The Home Valuation Report is an in-depth analysis detailing your home's value as well as a comparison with similar homes in the area
Home Values in the Area
Average Home Value in this Area
Purchase History
| Date | Buyer | Sale Price | Title Company |
|---|---|---|---|
| Johnson Alicia Lee | $666,000 | Western Resources Title | |
| Cusano John | -- | Fidelity National Title | |
| Cusano John | -- | -- | |
| Cusano John | -- | -- | |
| Cusano John | $219,000 | Chicago Title Company |
Source: Public Records
Mortgage History
| Date | Status | Borrower | Loan Amount |
|---|---|---|---|
| Previous Owner | Cusano John | $544,185 |
Source: Public Records
Tax History Compared to Growth
Tax History
| Year | Tax Paid | Tax Assessment Tax Assessment Total Assessment is a certain percentage of the fair market value that is determined by local assessors to be the total taxable value of land and additions on the property. | Land | Improvement |
|---|---|---|---|---|
| 2025 | $7,612 | $720,791 | $405,912 | $314,879 |
| 2024 | $7,519 | $706,658 | $397,953 | $308,705 |
| 2023 | $7,519 | $692,802 | $390,150 | $302,652 |
| 2022 | $7,401 | $679,218 | $382,500 | $296,718 |
| 2021 | $7,379 | $665,900 | $375,000 | $290,900 |
| 2020 | $3,674 | $326,112 | $148,909 | $177,203 |
| 2019 | $3,643 | $319,719 | $145,990 | $173,729 |
| 2018 | $3,595 | $313,451 | $143,128 | $170,323 |
| 2017 | $3,532 | $307,306 | $140,322 | $166,984 |
| 2016 | $3,341 | $301,281 | $137,571 | $163,710 |
| 2015 | $3,294 | $296,756 | $135,505 | $161,251 |
| 2014 | $3,177 | $290,944 | $132,851 | $158,093 |
Source: Public Records
Map
Nearby Homes
- 657 Vista Pacifica Cir
- 670 Vista Pacifica Cir
- 618 Vista Pacifica Cir
- 747 Vista Pacifica Cir
- 601 Vista Pacifica Cir
- 762 White Oak Blvd
- 2 Paseo Ladera Ln
- 234 Christine Way
- 108 Marian Way
- 45 La Gaviota
- 1032 Margarita
- 249 Margo Way
- 60 La Garza
- 910 N 12th St
- 117 Village Cir
- 850 N 12th St
- 834 N 5th St
- 676 N 12th St Unit 6
- 691 Charles St
- 201 Five Cities Dr Unit 100
- 172 Irish Way
- 176 Irish Way Unit LOT
- 176 Irish Way
- 168 Irish Way Unit LOT
- 168 Irish Way
- 164 Irish Way Unit 17
- 164 Irish Way Unit LOT
- 164 Irish Way
- 180 Irish Way
- 658 Vista Pacifica Cir
- 654 Vista Pacifica Cir
- 662 Vista Pacifica Cir
- 160 Irish Way
- 184 Irish Way
- 646 Vista Pacifica Cir
- 666 Vista Pacifica Cir
- 169 Irish Way
- 175 Irish Way
- 165 Irish Way
- 642 Vista Pacifica Cir