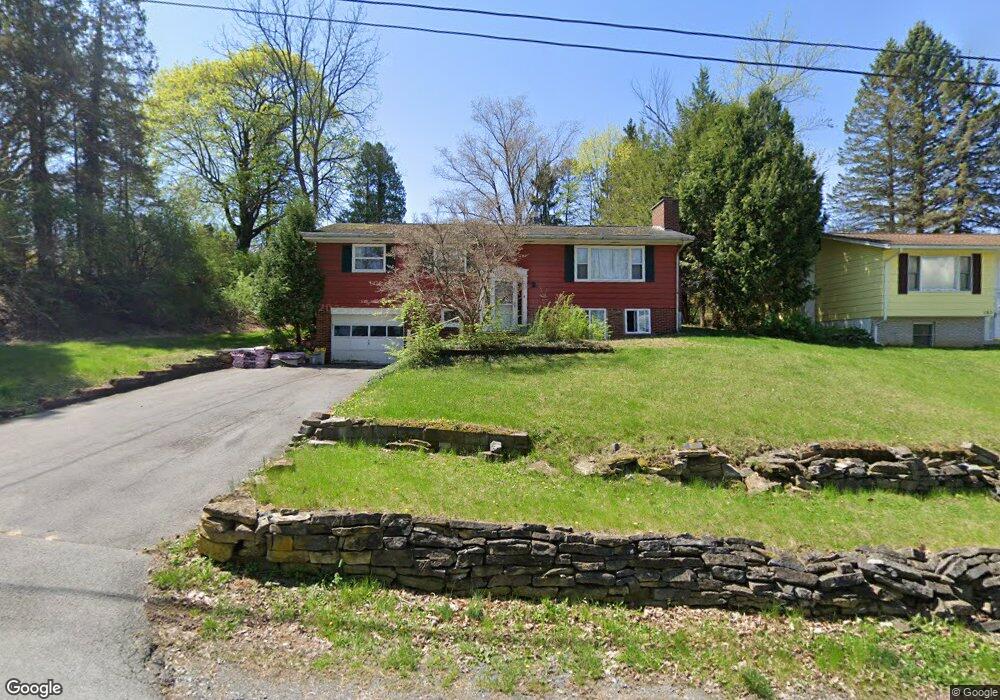
172 Lenor Dr State College, PA 16801
Estimated Value: $290,000 - $385,000
5
Beds
4
Baths
1,884
Sq Ft
$184/Sq Ft
Est. Value
About This Home
This home is located at 172 Lenor Dr, State College, PA 16801 and is currently estimated at $345,792, approximately $183 per square foot. 172 Lenor Dr is a home located in Centre County with nearby schools including Spring Creek Elementary, Mount Nittany Middle School, and State College Area High School.
Ownership History
Date
Name
Owned For
Owner Type
Purchase Details
Closed on
May 3, 2021
Sold by
Mcclellan Daren and Estate Of Delma K Mcclellan
Bought by
Dornich Robert E
Current Estimated Value
Purchase Details
Closed on
Jun 16, 2010
Sold by
Dick Kimberly A and Mcclellan Delma K
Bought by
Mcclellan Delma K
Purchase Details
Closed on
May 27, 2008
Sold by
Howes Justin M and Howes Amie M
Bought by
Dick Kimberly A and Mcclellan Delma K
Home Financials for this Owner
Home Financials are based on the most recent Mortgage that was taken out on this home.
Original Mortgage
$134,000
Interest Rate
6.1%
Mortgage Type
Purchase Money Mortgage
Purchase Details
Closed on
May 31, 2005
Sold by
Figart Christine
Bought by
Howes Justin M and Howes Amie M
Home Financials for this Owner
Home Financials are based on the most recent Mortgage that was taken out on this home.
Original Mortgage
$128,000
Interest Rate
5.12%
Mortgage Type
Fannie Mae Freddie Mac
Create a Home Valuation Report for This Property
The Home Valuation Report is an in-depth analysis detailing your home's value as well as a comparison with similar homes in the area
Home Values in the Area
Average Home Value in this Area
Purchase History
| Date | Buyer | Sale Price | Title Company |
|---|---|---|---|
| Dornich Robert E | $210,000 | Equity National Title | |
| Mcclellan Delma K | -- | None Available | |
| Dick Kimberly A | $191,500 | None Available | |
| Howes Justin M | $160,000 | -- |
Source: Public Records
Mortgage History
| Date | Status | Borrower | Loan Amount |
|---|---|---|---|
| Previous Owner | Dick Kimberly A | $134,000 | |
| Previous Owner | Howes Justin M | $128,000 | |
| Closed | Howes Justin M | $32,000 |
Source: Public Records
Tax History Compared to Growth
Tax History
| Year | Tax Paid | Tax Assessment Tax Assessment Total Assessment is a certain percentage of the fair market value that is determined by local assessors to be the total taxable value of land and additions on the property. | Land | Improvement |
|---|---|---|---|---|
| 2025 | $3,260 | $50,255 | $6,395 | $43,860 |
| 2024 | $3,095 | $50,255 | $6,395 | $43,860 |
| 2023 | $3,095 | $50,255 | $6,395 | $43,860 |
| 2022 | $3,017 | $50,255 | $6,395 | $43,860 |
| 2021 | $3,017 | $50,255 | $6,395 | $43,860 |
| 2020 | $2,889 | $48,375 | $6,395 | $41,980 |
| 2019 | $2,382 | $48,375 | $6,395 | $41,980 |
| 2018 | $2,776 | $48,375 | $6,395 | $41,980 |
| 2017 | $2,744 | $48,375 | $6,395 | $41,980 |
| 2016 | -- | $48,375 | $6,395 | $41,980 |
| 2015 | -- | $48,375 | $6,395 | $41,980 |
| 2014 | -- | $48,375 | $6,395 | $41,980 |
Source: Public Records
Map
Nearby Homes
- 899 Walnut Spring Ln
- 933 Oak Ridge Ave
- 1035 Oak Ridge Ave
- 101 Timber Ln
- 110 Green Acres Ln
- 124 Grandview Rd
- 108 Grandview Rd
- 318 Bottorf Dr
- 216 Shady Dr
- 1719 Puddintown Rd
- 1516 Elizabeth Rd
- 301 Goldfinch Dr
- 1807 E Branch Rd
- 116 Broad Oak Ln
- 118 Broad Oak Ln
- 127 Broad Oak Ln
- 122 Broad Oak Ln
- 124 Broad Oak Ln
- 833 Elmwood St
- 418 Pike St