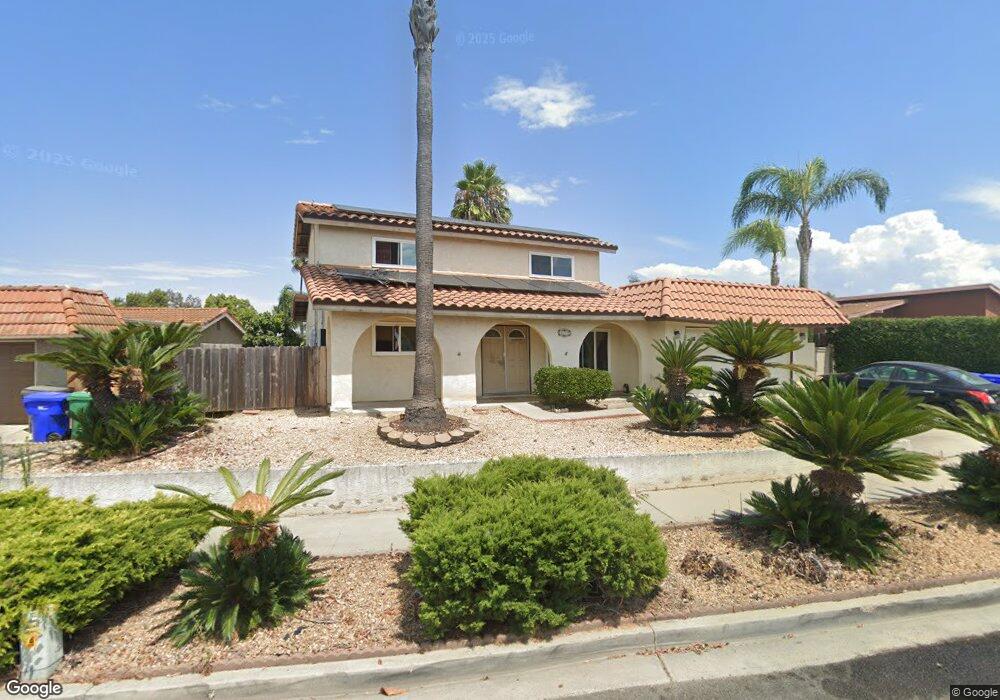
172 Mckinley St Oceanside, CA 92057
Guajome NeighborhoodEstimated Value: $764,391 - $920,000
4
Beds
2
Baths
1,621
Sq Ft
$519/Sq Ft
Est. Value
About This Home
This home is located at 172 Mckinley St, Oceanside, CA 92057 and is currently estimated at $841,848, approximately $519 per square foot. 172 Mckinley St is a home located in San Diego County with nearby schools including Del Rio Elementary School, Cesar Chavez Middle School, and El Camino High School.
Ownership History
Date
Name
Owned For
Owner Type
Purchase Details
Closed on
Jan 24, 2022
Sold by
Federico Foster Family Trust
Bought by
John And Lashawn Saiz 2019 Trust
Current Estimated Value
Purchase Details
Closed on
Sep 25, 2019
Sold by
Foster Federico M and Foster Laura P
Bought by
Foster Federico M and Federico Foster Family Trust
Purchase Details
Closed on
Nov 19, 1997
Sold by
Va
Bought by
Foster Federico M and Foster Laura P
Home Financials for this Owner
Home Financials are based on the most recent Mortgage that was taken out on this home.
Original Mortgage
$131,000
Interest Rate
7.31%
Mortgage Type
VA
Purchase Details
Closed on
Oct 2, 1996
Sold by
Norwest Mtg Inc
Bought by
Va
Purchase Details
Closed on
Jul 19, 1993
Sold by
Clement Robert and Clement Teria L
Bought by
Howell Jan R and Howell Estela
Home Financials for this Owner
Home Financials are based on the most recent Mortgage that was taken out on this home.
Original Mortgage
$133,650
Interest Rate
7.16%
Mortgage Type
VA
Purchase Details
Closed on
Jan 24, 1983
Create a Home Valuation Report for This Property
The Home Valuation Report is an in-depth analysis detailing your home's value as well as a comparison with similar homes in the area
Home Values in the Area
Average Home Value in this Area
Purchase History
| Date | Buyer | Sale Price | Title Company |
|---|---|---|---|
| John And Lashawn Saiz 2019 Trust | -- | None Listed On Document | |
| Foster Federico M | -- | None Available | |
| Foster Federico M | $135,000 | First American Title | |
| Va | -- | -- | |
| Norwest Mtg Inc | $106,537 | First American Title Ins Co | |
| Howell Jan R | $132,000 | United Title Company | |
| -- | $92,500 | -- |
Source: Public Records
Mortgage History
| Date | Status | Borrower | Loan Amount |
|---|---|---|---|
| Previous Owner | Foster Federico M | $131,000 | |
| Previous Owner | Howell Jan R | $133,650 |
Source: Public Records
Tax History Compared to Growth
Tax History
| Year | Tax Paid | Tax Assessment Tax Assessment Total Assessment is a certain percentage of the fair market value that is determined by local assessors to be the total taxable value of land and additions on the property. | Land | Improvement |
|---|---|---|---|---|
| 2025 | $2,328 | $214,892 | $86,208 | $128,684 |
| 2024 | $2,328 | $210,679 | $84,518 | $126,161 |
| 2023 | $8,064 | $725,000 | $386,000 | $339,000 |
| 2022 | $2,220 | $198,531 | $79,645 | $118,886 |
| 2021 | $2,227 | $198,531 | $79,645 | $118,886 |
| 2020 | $2,158 | $196,496 | $78,829 | $117,667 |
| 2019 | $2,095 | $192,644 | $77,284 | $115,360 |
| 2018 | $2,071 | $188,868 | $75,769 | $113,099 |
| 2017 | $2,032 | $185,166 | $74,284 | $110,882 |
| 2016 | $1,964 | $181,536 | $72,828 | $108,708 |
| 2015 | $1,907 | $178,811 | $71,735 | $107,076 |
| 2014 | $1,833 | $175,309 | $70,330 | $104,979 |
Source: Public Records
Map
Nearby Homes
- 166 Harrison St
- 5110 N River Rd Unit E
- 150 N River Cir Unit 105
- 5037 Los Morros Way Unit 71
- 5045 Los Morros Way Unit 78
- 5510 Giovanni Way
- 5463 Giovanni Way
- 4843 Sagina Ct Unit 6
- 534 Luna Dr
- 648 Flora Dr
- 538 Luna Dr
- 104 Mellano Way
- Magnolia 1 Plan at North River Farms - Magnolia
- Magnolia 4 Plan at North River Farms - Magnolia
- Monterey 3 Plan at North River Farms - Monterey
- Monarch 3 Plan at North River Farms - Monarch
- Cypress 1 Plan at North River Farms - Cypress
- Cypress 2 Plan at North River Farms - Cypress
- Magnolia 3 Plan at North River Farms - Magnolia
- Monarch 1 Plan at North River Farms - Monarch
- 166 Mckinley St
- 178 Mckinley St
- 163 Harding St
- 160 Mckinley St
- 165 Harding St
- 184 Mckinley St
- 157 Harding St
- 173 Mckinley St
- 179 Mckinley St
- 185 Mckinley St
- 169 Harding St
- 167 Mckinley St
- 151 Harding St
- 154 Mckinley St
- 190 Mckinley St
- 191 Mckinley St
- 161 Mckinley St
- 173 Harding St
- 197 Mckinley St
- 147 Harding St