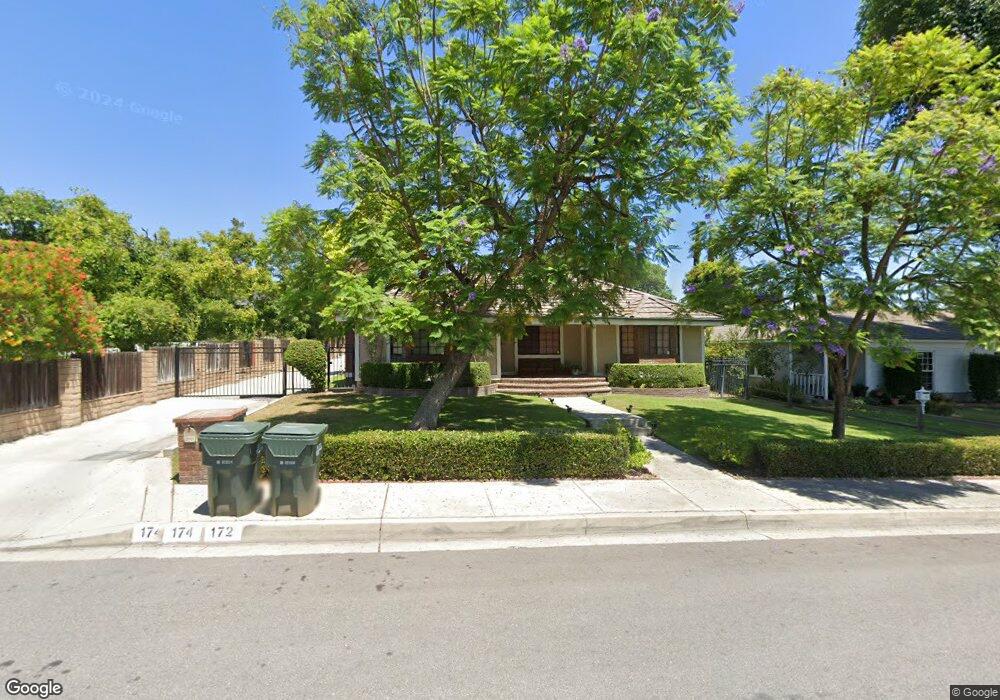
172 N Sunset Place Monrovia, CA 91016
Estimated Value: $1,598,635 - $1,839,000
4
Beds
3
Baths
2,674
Sq Ft
$649/Sq Ft
Est. Value
About This Home
This home is located at 172 N Sunset Place, Monrovia, CA 91016 and is currently estimated at $1,734,659, approximately $648 per square foot. 172 N Sunset Place is a home located in Los Angeles County with nearby schools including Mayflower Elementary School, Clifton Middle School, and Monrovia High School.
Ownership History
Date
Name
Owned For
Owner Type
Purchase Details
Closed on
Aug 21, 2012
Sold by
Wang Su Ping and Wang Stephen
Bought by
Wang Stephen and Wang Stephanie Su Ping
Current Estimated Value
Home Financials for this Owner
Home Financials are based on the most recent Mortgage that was taken out on this home.
Original Mortgage
$130,800
Outstanding Balance
$55,818
Interest Rate
3.49%
Mortgage Type
New Conventional
Estimated Equity
$1,678,841
Purchase Details
Closed on
Sep 12, 2011
Sold by
Wang Su Ping and Wang Stephen
Bought by
Wang Stephen and Wang Stephanie Su Ping
Purchase Details
Closed on
Aug 24, 2011
Sold by
Wang Su Ping and Wang Stephen
Bought by
Wang Su Ping and Wang Stephen
Purchase Details
Closed on
Jul 5, 1994
Sold by
Balogh Ralph and Balogh Rose Anne
Bought by
Balogh Ralph H
Home Financials for this Owner
Home Financials are based on the most recent Mortgage that was taken out on this home.
Original Mortgage
$21,489
Interest Rate
8.6%
Create a Home Valuation Report for This Property
The Home Valuation Report is an in-depth analysis detailing your home's value as well as a comparison with similar homes in the area
Home Values in the Area
Average Home Value in this Area
Purchase History
| Date | Buyer | Sale Price | Title Company |
|---|---|---|---|
| Wang Stephen | -- | None Available | |
| Wang Su Ping | -- | Calcounties Title Nation | |
| Wang Stephen | -- | None Available | |
| Wang Su Ping | -- | None Available | |
| Balogh Ralph H | -- | California Counties Title |
Source: Public Records
Mortgage History
| Date | Status | Borrower | Loan Amount |
|---|---|---|---|
| Open | Wang Su Ping | $130,800 | |
| Closed | Balogh Ralph H | $21,489 |
Source: Public Records
Tax History Compared to Growth
Tax History
| Year | Tax Paid | Tax Assessment Tax Assessment Total Assessment is a certain percentage of the fair market value that is determined by local assessors to be the total taxable value of land and additions on the property. | Land | Improvement |
|---|---|---|---|---|
| 2025 | $11,109 | $819,933 | $437,299 | $382,634 |
| 2024 | $11,109 | $803,857 | $428,725 | $375,132 |
| 2023 | $10,858 | $788,096 | $420,319 | $367,777 |
| 2022 | $10,546 | $772,644 | $412,078 | $360,566 |
| 2021 | $10,335 | $757,496 | $403,999 | $353,497 |
| 2019 | $9,846 | $735,030 | $392,017 | $343,013 |
| 2018 | $9,518 | $720,619 | $384,331 | $336,288 |
| 2016 | $9,142 | $692,639 | $369,408 | $323,231 |
| 2015 | $8,942 | $682,236 | $363,860 | $318,376 |
| 2014 | $8,851 | $668,873 | $356,733 | $312,140 |
Source: Public Records
Map
Nearby Homes
- 171 N Sunset Place
- 846 W Hillcrest Blvd
- 803 Crescent Dr
- 891 Crescent Dr
- 208 Highland Place
- 836 W Foothill Blvd Unit A
- 221 Violet Ave Unit A
- 214 Fowler Dr
- 550 W Foothill Blvd Unit C
- 325 N Madison Ave
- 318 N Terrace View Dr
- 330 N Madison Ave
- 1209 Valencia Way
- 324 Fowler Dr
- 320 Laurel Ave
- 327 S Lincoln Place Unit 2
- 334 Linwood Ave
- 755 W Colorado Blvd
- 367 Monterey Pines Dr
- 644 W Colorado Blvd
- 170 N Sunset Place
- 166 N Sunset Place
- 174 N Sunset Place
- 200 N Sunset Place
- 176 N Sunset Place
- 216 N Sunset Place
- 175 N Sunset Place
- 163 N Sunset Place
- 201 N Sunset Place
- 732 W Hillcrest Blvd
- 728 W Hillcrest Blvd
- 159 N Sunset Place
- 220 N Sunset Place
- 175 El Nido Ave
- 171 El Nido Ave
- 209 N Sunset Place
- 167 El Nido Ave
- 205 El Nido Ave
- 724 W Hillcrest Blvd
- 163 El Nido Ave