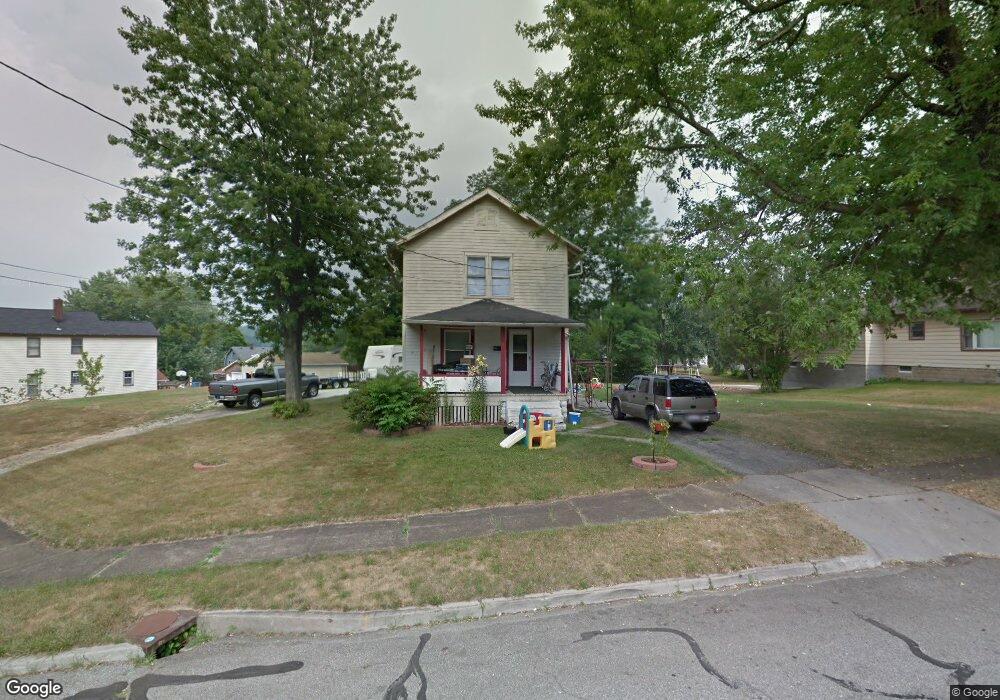
172 Parkway St Struthers, OH 44471
Estimated Value: $70,000 - $77,000
3
Beds
2
Baths
1,240
Sq Ft
$58/Sq Ft
Est. Value
About This Home
This home is located at 172 Parkway St, Struthers, OH 44471 and is currently estimated at $72,329, approximately $58 per square foot. 172 Parkway St is a home located in Mahoning County with nearby schools including Mckamy Elementary School, Carrollton Elementary School, and Lovett Elementary School.
Ownership History
Date
Name
Owned For
Owner Type
Purchase Details
Closed on
May 4, 2023
Bought by
Rodman Rentals Llc
Current Estimated Value
Home Financials for this Owner
Home Financials are based on the most recent Mortgage that was taken out on this home.
Interest Rate
6.39%
Purchase Details
Closed on
Apr 11, 2023
Sold by
Fusillo Vincent J
Bought by
Rodman Rentals Llc
Home Financials for this Owner
Home Financials are based on the most recent Mortgage that was taken out on this home.
Interest Rate
6.39%
Purchase Details
Closed on
Aug 16, 2006
Sold by
Crawford John D and Crawford William David
Bought by
Fasillo Vincent J
Home Financials for this Owner
Home Financials are based on the most recent Mortgage that was taken out on this home.
Original Mortgage
$30,000
Interest Rate
6.88%
Mortgage Type
Stand Alone First
Purchase Details
Closed on
Nov 8, 1982
Bought by
Crawford John D
Create a Home Valuation Report for This Property
The Home Valuation Report is an in-depth analysis detailing your home's value as well as a comparison with similar homes in the area
Home Values in the Area
Average Home Value in this Area
Purchase History
| Date | Buyer | Sale Price | Title Company |
|---|---|---|---|
| Rodman Rentals Llc | $22,000 | -- | |
| Rodman Rentals Llc | $22,000 | -- | |
| Rodman Rentals Llc | $22,000 | None Listed On Document | |
| Rodman Rentals Llc | $22,000 | None Listed On Document | |
| Fasillo Vincent J | $30,000 | None Available | |
| Crawford John D | $10,000 | -- |
Source: Public Records
Mortgage History
| Date | Status | Borrower | Loan Amount |
|---|---|---|---|
| Closed | Rodman Rentals Llc | -- | |
| Previous Owner | Fasillo Vincent J | $30,000 |
Source: Public Records
Tax History Compared to Growth
Tax History
| Year | Tax Paid | Tax Assessment Tax Assessment Total Assessment is a certain percentage of the fair market value that is determined by local assessors to be the total taxable value of land and additions on the property. | Land | Improvement |
|---|---|---|---|---|
| 2024 | $500 | $11,690 | $1,730 | $9,960 |
| 2023 | $481 | $11,690 | $1,730 | $9,960 |
| 2022 | $333 | $6,120 | $1,730 | $4,390 |
| 2021 | $330 | $6,120 | $1,730 | $4,390 |
| 2020 | $332 | $6,120 | $1,730 | $4,390 |
| 2019 | $303 | $5,030 | $1,730 | $3,300 |
| 2018 | $334 | $5,030 | $1,730 | $3,300 |
| 2017 | $288 | $5,030 | $1,730 | $3,300 |
| 2016 | $290 | $5,220 | $1,730 | $3,490 |
| 2015 | $298 | $5,220 | $1,730 | $3,490 |
| 2014 | $284 | $5,220 | $1,730 | $3,490 |
| 2013 | $264 | $5,220 | $1,730 | $3,490 |
Source: Public Records
Map
Nearby Homes
- 0 Ridge Way Unit 5021568
- 180 Poland Ave
- 0 Ridgeway St
- 78 Sexton St
- 42 Wilson St
- 93 Morrison St
- 18 W Faith St
- 129 Sexton St
- 60 Grandview Ave
- 34 W Lewis St
- 155 Morrison St
- 97 Overlook Blvd
- 0 Center St Unit 5021584
- 0 Center St Unit 5021587
- 0 Center St Unit 5021580
- 0 Center St Unit 5021576
- 21 Katherine St
- 0 Harding St
- 59 Harvey St
- 227 Maplewood Ave