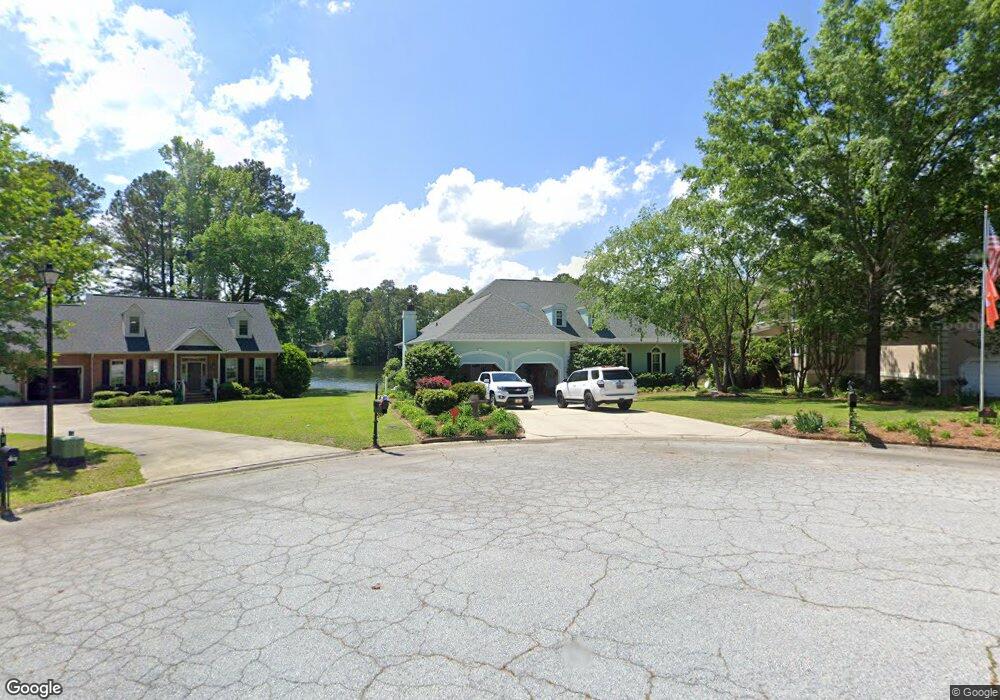
172 Rum Gully Ln Chapin, SC 29036
Estimated Value: $871,000 - $1,059,000
4
Beds
4
Baths
3,993
Sq Ft
$252/Sq Ft
Est. Value
About This Home
This home is located at 172 Rum Gully Ln, Chapin, SC 29036 and is currently estimated at $1,008,091, approximately $252 per square foot. 172 Rum Gully Ln is a home located in Lexington County with nearby schools including Chapin Elementary School, Chapin Intermediate, and Chapin High School.
Ownership History
Date
Name
Owned For
Owner Type
Purchase Details
Closed on
Jul 13, 2020
Sold by
Demars Alice M and Demars John W
Bought by
Coleman Kimberly H and Coleman John F
Current Estimated Value
Home Financials for this Owner
Home Financials are based on the most recent Mortgage that was taken out on this home.
Original Mortgage
$594,000
Outstanding Balance
$533,994
Interest Rate
3.87%
Mortgage Type
New Conventional
Estimated Equity
$474,097
Purchase Details
Closed on
Dec 14, 2016
Sold by
Demars Alice M
Bought by
Demars Alice M and Alice M Demars Revocable Trust
Purchase Details
Closed on
Sep 30, 2005
Sold by
Thomas George and Thomas Jo Ann
Bought by
Demars John W and Demars Alice M
Home Financials for this Owner
Home Financials are based on the most recent Mortgage that was taken out on this home.
Original Mortgage
$359,900
Interest Rate
5.66%
Mortgage Type
New Conventional
Create a Home Valuation Report for This Property
The Home Valuation Report is an in-depth analysis detailing your home's value as well as a comparison with similar homes in the area
Home Values in the Area
Average Home Value in this Area
Purchase History
| Date | Buyer | Sale Price | Title Company |
|---|---|---|---|
| Coleman Kimberly H | $660,000 | None Available | |
| Demars Alice M | -- | None Available | |
| Demars John W | -- | None Available | |
| Demars John W | $589,900 | -- |
Source: Public Records
Mortgage History
| Date | Status | Borrower | Loan Amount |
|---|---|---|---|
| Open | Coleman Kimberly H | $594,000 | |
| Previous Owner | Demars John W | $359,900 |
Source: Public Records
Tax History Compared to Growth
Tax History
| Year | Tax Paid | Tax Assessment Tax Assessment Total Assessment is a certain percentage of the fair market value that is determined by local assessors to be the total taxable value of land and additions on the property. | Land | Improvement |
|---|---|---|---|---|
| 2024 | $4,039 | $26,400 | $9,600 | $16,800 |
| 2023 | $4,039 | $26,400 | $9,600 | $16,800 |
| 2022 | $4,075 | $26,400 | $9,600 | $16,800 |
| 2020 | $3,376 | $23,320 | $8,800 | $14,520 |
| 2019 | $3,163 | $21,659 | $6,693 | $14,966 |
| 2018 | $2,777 | $21,659 | $6,693 | $14,966 |
| 2017 | $2,702 | $21,659 | $6,693 | $14,966 |
| 2016 | $2,778 | $21,654 | $6,692 | $14,962 |
| 2015 | $2,363 | $21,654 | $6,692 | $14,962 |
| 2014 | $2,363 | $18,831 | $5,520 | $13,311 |
| 2013 | -- | $18,830 | $5,520 | $13,310 |
Source: Public Records
Map
Nearby Homes
- 140 Rum Gully Ln
- 190 Hunter Dr
- 161 Nel-La Ln
- 1040 Night Harbor Cir
- 842 Misty Harbor Rd
- Sabel Plan at Night Harbor
- Azalea Plan at Night Harbor
- Edisto II Plan at Night Harbor
- Magnolia Plan at Night Harbor
- Carol Plan at Night Harbor
- 0 Greengarden Dr Unit T 601550
- 0 Greengarden Dr Unit Q 601548
- 0 Greengarden Dr Unit W 600899
- 0 Greengarden Dr Unit V 600897
- 0 Greengarden Dr Unit U 600740
- 0 Greengarden Dr Unit A 600737
- 0 Greengarden Dr Unit P 600736
- 0 Greengarden Dr Unit 600735
- 249 Daymark Dr
- 404 Lombard Way
- 168 Rum Gully Ln
- 176 Rum Gully Ln
- 164 Rum Gully Ln
- 180 Rum Gully Ln
- 184 Rum Gully Ln
- 160 Rum Gully Ln
- 188 Rum Gully Ln
- 156 Rum Gully Ln
- 152 Rum Gully Ln
- 339 Wingo Ct
- 148 Rum Gully Ln
- 348 Flicker Ln
- 332 Flicker Ln
- 144 Rum Gully Ln
- 344 Flicker Ln
- 340 Flicker Ln
- 324 Wingo Ct
- 163 Dallas Dr
- 151 Dallas Dr
- 136 Rum Gully Ln