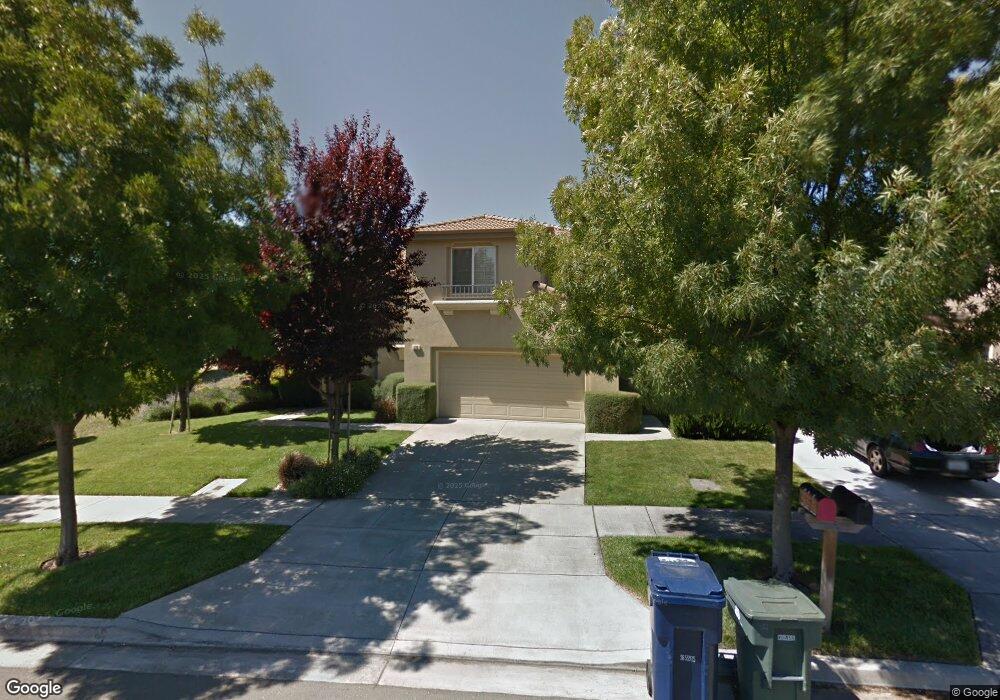
172 Via Bellagio American Canyon, CA 94503
Estimated Value: $734,814 - $808,000
4
Beds
3
Baths
2,126
Sq Ft
$362/Sq Ft
Est. Value
About This Home
This home is located at 172 Via Bellagio, American Canyon, CA 94503 and is currently estimated at $769,204, approximately $361 per square foot. 172 Via Bellagio is a home located in Napa County with nearby schools including Canyon Oaks Elementary School, American Canyon Middle School, and American Canyon High School.
Ownership History
Date
Name
Owned For
Owner Type
Purchase Details
Closed on
Jan 3, 2022
Sold by
Villasenor Fernando
Bought by
Villasenor Fernando and The Fernando Villasenor Living
Current Estimated Value
Purchase Details
Closed on
Aug 1, 2005
Sold by
Villasenor Fernando
Bought by
Villasenor Fernando
Home Financials for this Owner
Home Financials are based on the most recent Mortgage that was taken out on this home.
Original Mortgage
$180,000
Outstanding Balance
$92,745
Interest Rate
5.46%
Mortgage Type
Credit Line Revolving
Estimated Equity
$676,459
Purchase Details
Closed on
Dec 4, 2003
Sold by
Villasenor Nicole
Bought by
Villasenor Fernando
Purchase Details
Closed on
Aug 12, 2002
Sold by
Shea Homes Ltd Partnership
Bought by
Villasenor Fernando and Villasenor Nicole
Home Financials for this Owner
Home Financials are based on the most recent Mortgage that was taken out on this home.
Original Mortgage
$300,700
Outstanding Balance
$118,748
Interest Rate
5.62%
Estimated Equity
$650,456
Create a Home Valuation Report for This Property
The Home Valuation Report is an in-depth analysis detailing your home's value as well as a comparison with similar homes in the area
Home Values in the Area
Average Home Value in this Area
Purchase History
| Date | Buyer | Sale Price | Title Company |
|---|---|---|---|
| Villasenor Fernando | -- | None Available | |
| Villasenor Fernando | -- | Fidelity National Title Co | |
| Villasenor Fernando | -- | -- | |
| Villasenor Fernando | $389,500 | First American Title Co |
Source: Public Records
Mortgage History
| Date | Status | Borrower | Loan Amount |
|---|---|---|---|
| Open | Villasenor Fernando | $180,000 | |
| Open | Villasenor Fernando | $300,700 | |
| Closed | Villasenor Fernando | $49,550 |
Source: Public Records
Tax History Compared to Growth
Tax History
| Year | Tax Paid | Tax Assessment Tax Assessment Total Assessment is a certain percentage of the fair market value that is determined by local assessors to be the total taxable value of land and additions on the property. | Land | Improvement |
|---|---|---|---|---|
| 2025 | $7,418 | $563,661 | $144,821 | $418,840 |
| 2024 | $7,418 | $552,610 | $141,982 | $410,628 |
| 2023 | $7,418 | $541,776 | $139,199 | $402,577 |
| 2022 | $7,229 | $531,154 | $136,470 | $394,684 |
| 2021 | $7,078 | $520,741 | $133,795 | $386,946 |
| 2020 | $7,203 | $515,403 | $132,424 | $382,979 |
| 2019 | $7,191 | $505,298 | $129,828 | $375,470 |
| 2018 | $7,128 | $495,391 | $127,283 | $368,108 |
| 2017 | $7,025 | $485,679 | $124,788 | $360,891 |
| 2016 | $6,493 | $440,414 | $120,534 | $319,880 |
| 2015 | $5,909 | $409,688 | $112,125 | $297,563 |
| 2014 | $5,012 | $327,750 | $89,700 | $238,050 |
Source: Public Records
Map
Nearby Homes
- 75 Castellina Cir
- 23 Castellina Cir
- 1710 American Canyon Rd
- 224 Pinecreek Ln
- 9 Kevin Ln
- 121 Sutton Place Unit Lot16
- 2525 Flosden Rd Unit 61
- 244 American Canyon Rd Unit 193
- 244 American Canyon Rd Unit 25
- 244 American Canyon Rd Unit 102
- 420 Sandstone Dr
- 1305 Corcoran Ave
- 350 Notre Dame Dr
- 200 Fieldstone Ct
- 3000 Broadway St Unit 16
- 3000 Broadway St Unit 13
- 3000 St Unit 92
- 106 Fieldstone Way
- 172 Smokey Hills Dr
- 500 Granite Springs Way
- 168 Via Bellagio
- 126 Castellina Cir
- 122 Castellina Cir
- 164 Via Bellagio
- 130 Castellina Cir
- 134 Castellina Cir
- 118 Castellina Cir
- 160 Via Bellagio
- 79 Montecarlo Way
- 138 Castellina Cir
- 167 Via Bellagio
- 75 Montecarlo Way
- 114 Castellina Cir
- 3 Castellina Cir
- 7 Castellina Cir
- 163 Via Bellagio
- 11 Castellina Cir
- 110 Castellina Cir
- 71 Montecarlo Way
- 15 Castellina Cir