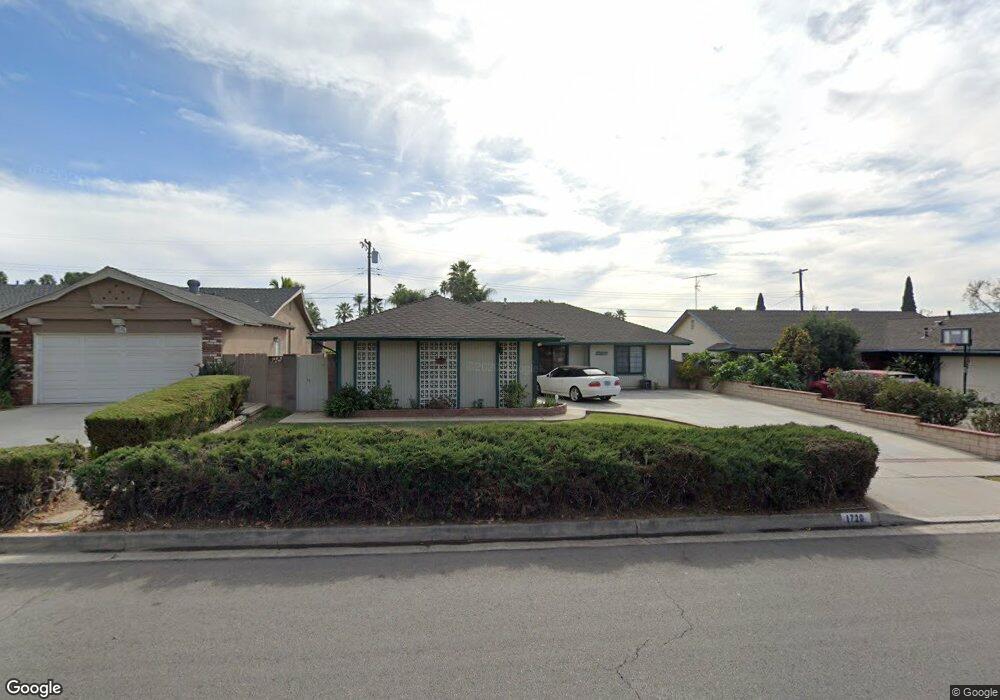
1720 E Stearns Ave La Habra, CA 90631
Estimated Value: $895,000 - $953,000
4
Beds
2
Baths
1,698
Sq Ft
$537/Sq Ft
Est. Value
About This Home
This home is located at 1720 E Stearns Ave, La Habra, CA 90631 and is currently estimated at $911,844, approximately $537 per square foot. 1720 E Stearns Ave is a home located in Orange County with nearby schools including Sierra Vista Elementary School, Ladera Palma Elementary School, and Washington Middle School.
Ownership History
Date
Name
Owned For
Owner Type
Purchase Details
Closed on
Feb 7, 2018
Sold by
Romero Joe L and Romero Cathy L
Bought by
Romero Joe L and Romero Cathy L
Current Estimated Value
Home Financials for this Owner
Home Financials are based on the most recent Mortgage that was taken out on this home.
Original Mortgage
$370,000
Outstanding Balance
$313,357
Interest Rate
3.99%
Mortgage Type
New Conventional
Estimated Equity
$598,487
Purchase Details
Closed on
Aug 14, 2000
Sold by
Gresch Douglas James and Gresch Becky Marie
Bought by
Whitmore Ernest L and Whitmore Beatrice G
Purchase Details
Closed on
Oct 8, 1996
Sold by
Teeter Robert A and Teeter Kathy Kathy
Bought by
Romero Joey L and Romero Cathy L
Home Financials for this Owner
Home Financials are based on the most recent Mortgage that was taken out on this home.
Original Mortgage
$163,400
Interest Rate
8.3%
Create a Home Valuation Report for This Property
The Home Valuation Report is an in-depth analysis detailing your home's value as well as a comparison with similar homes in the area
Home Values in the Area
Average Home Value in this Area
Purchase History
| Date | Buyer | Sale Price | Title Company |
|---|---|---|---|
| Romero Joe L | -- | Chicago Title Co | |
| Whitmore Ernest L | $226,500 | North American Title Co | |
| Romero Joey L | $172,000 | Commonwealth Land Title |
Source: Public Records
Mortgage History
| Date | Status | Borrower | Loan Amount |
|---|---|---|---|
| Open | Romero Joe L | $370,000 | |
| Previous Owner | Romero Joey L | $163,400 |
Source: Public Records
Tax History Compared to Growth
Tax History
| Year | Tax Paid | Tax Assessment Tax Assessment Total Assessment is a certain percentage of the fair market value that is determined by local assessors to be the total taxable value of land and additions on the property. | Land | Improvement |
|---|---|---|---|---|
| 2025 | $3,299 | $280,122 | $181,264 | $98,858 |
| 2024 | $3,299 | $274,630 | $177,710 | $96,920 |
| 2023 | $3,220 | $269,246 | $174,226 | $95,020 |
| 2022 | $3,183 | $263,967 | $170,810 | $93,157 |
| 2021 | $3,130 | $258,792 | $167,461 | $91,331 |
| 2020 | $3,100 | $256,139 | $165,744 | $90,395 |
| 2019 | $3,017 | $251,117 | $162,494 | $88,623 |
| 2018 | $2,966 | $246,194 | $159,308 | $86,886 |
| 2017 | $2,912 | $241,367 | $156,184 | $85,183 |
| 2016 | $2,844 | $236,635 | $153,122 | $83,513 |
| 2015 | $2,763 | $233,081 | $150,822 | $82,259 |
| 2014 | $2,681 | $228,516 | $147,868 | $80,648 |
Source: Public Records
Map
Nearby Homes
- 410 N Fonda St
- 1400 Eastpark Dr
- 224 S Fonda St
- 1936 Skywood St
- 1663 Gatewood Ct
- 1018 E La Habra Blvd Unit 238
- 2211 Frantz Ave
- 1508 Mccart Ave
- 994 E La Habra Blvd Unit 246
- 1506 Bergman Ct
- 308 S Valencia St
- 1414 W Central Ave Unit 88
- 2121 Lake Side Dr Unit 158
- 1341 Harbor Lake Ave Unit 24
- 2201 Lake View Dr Unit 20
- 620 Lake Ridge Way Unit 45
- 551 Lake Grove Way Unit 165
- 2300 Lake Forest Cir Unit 113
- 1371 Pleasant Lake Place Unit 105
- 755 Village Lake Mall Unit 337
- 1730 E Stearns Ave
- 1710 E Stearns Ave
- 1721 Hodson Ave
- 1731 Hodson Ave
- 1711 Hodson Ave
- 1740 E Stearns Ave
- 1700 E Stearns Ave
- 1721 E Stearns Ave
- 1731 E Stearns Ave
- 1741 Hodson Ave
- 1701 Hodson Ave
- 1711 E Stearns Ave
- 1741 E Stearns Ave
- 1750 E Stearns Ave
- 1701 E Stearns Ave
- 1751 E Stearns Ave
- 1751 Hodson Ave
- 1801 E Stearns Ave
- 1800 E Stearns Ave
- 1720 Mateo Ave