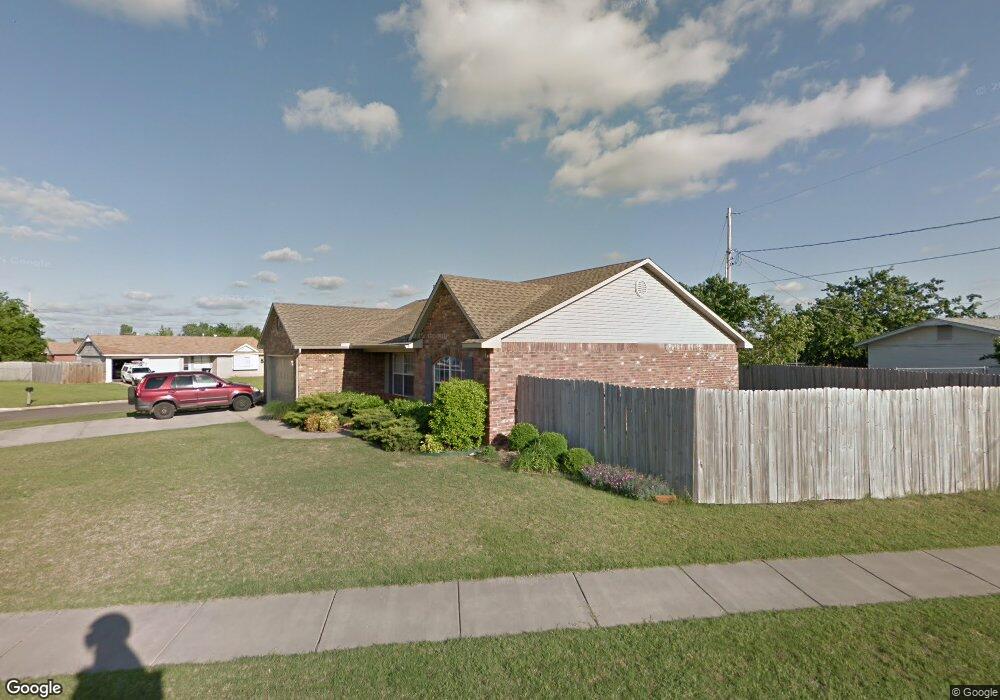
1720 Regency Blvd Moore, OK 73160
Regency Park NeighborhoodEstimated Value: $210,000 - $222,000
3
Beds
2
Baths
1,429
Sq Ft
$150/Sq Ft
Est. Value
About This Home
This home is located at 1720 Regency Blvd, Moore, OK 73160 and is currently estimated at $214,484, approximately $150 per square foot. 1720 Regency Blvd is a home located in Cleveland County with nearby schools including Kelley Elementary School, Highland West Junior High School, and Southmoore High School.
Ownership History
Date
Name
Owned For
Owner Type
Purchase Details
Closed on
Mar 28, 2012
Sold by
Blankenship Shawn and Blankenship Melissa M
Bought by
Clowser Shelia M
Current Estimated Value
Home Financials for this Owner
Home Financials are based on the most recent Mortgage that was taken out on this home.
Original Mortgage
$119,881
Outstanding Balance
$81,550
Interest Rate
3.97%
Mortgage Type
FHA
Estimated Equity
$132,934
Purchase Details
Closed on
Jul 13, 2006
Sold by
Salas Tony and Salas Christina
Bought by
Blankenship Shawn and Blankenship Melissa M
Home Financials for this Owner
Home Financials are based on the most recent Mortgage that was taken out on this home.
Original Mortgage
$116,570
Interest Rate
6.6%
Mortgage Type
FHA
Purchase Details
Closed on
Aug 2, 2002
Sold by
Northstar Group, Inc
Bought by
Salas Tony and Salas Christina
Create a Home Valuation Report for This Property
The Home Valuation Report is an in-depth analysis detailing your home's value as well as a comparison with similar homes in the area
Home Values in the Area
Average Home Value in this Area
Purchase History
| Date | Buyer | Sale Price | Title Company |
|---|---|---|---|
| Clowser Shelia M | $123,000 | American Eagle Title Group | |
| Blankenship Shawn | $118,500 | None Available | |
| Salas Tony | $102,500 | -- |
Source: Public Records
Mortgage History
| Date | Status | Borrower | Loan Amount |
|---|---|---|---|
| Open | Clowser Shelia M | $119,881 | |
| Previous Owner | Blankenship Shawn | $116,570 |
Source: Public Records
Tax History
| Year | Tax Paid | Tax Assessment Tax Assessment Total Assessment is a certain percentage of the fair market value that is determined by local assessors to be the total taxable value of land and additions on the property. | Land | Improvement |
|---|---|---|---|---|
| 2025 | $2,283 | $18,651 | $3,343 | $15,308 |
| 2023 | $2,061 | $16,917 | $3,181 | $13,736 |
| 2022 | $1,994 | $16,112 | $3,286 | $12,826 |
| 2021 | $1,907 | $15,345 | $2,809 | $12,536 |
| 2020 | $1,816 | $14,614 | $1,920 | $12,694 |
| 2019 | $1,851 | $14,614 | $1,920 | $12,694 |
| 2018 | $1,850 | $14,614 | $1,920 | $12,694 |
| 2017 | $1,861 | $14,614 | $0 | $0 |
| 2016 | $1,873 | $14,614 | $1,920 | $12,694 |
| 2015 | $1,695 | $14,614 | $1,920 | $12,694 |
| 2014 | $1,656 | $13,949 | $1,080 | $12,869 |
Source: Public Records
Map
Nearby Homes
- 1725 Queensbury Rd
- 937 NW 19th St
- 840 N Windermere Dr
- 929 NW 20th St
- 785 NW 16th St
- 936 NW 15th St
- 877 NW 14th St
- 704 NW 21st St
- 1449 N Norman Ave
- 644 NW 20th St
- 1035 NW 20th St
- 624 NW 21st St
- 2404 Piccadilly Cir
- 2401 Piccadilly Cir
- 665 NW 15th St
- 1837 City Ave
- 912 NW 24th St
- 1317 Lawton
- 1212 Kings Ct
- 2512 Yorkshire Ave
- 1542 Tudor Dr
- 1532 Tudor Dr
- 1716 Regency Blvd
- 1537 Tudor Dr
- 1528 Tudor Dr
- 1600 Tudor Dr
- 1541 Tudor Dr
- 1712 Regency Blvd
- 1533 Tudor Dr
- 1601 Queensbury Rd
- 1524 Tudor Dr
- 1604 Tudor Dr
- 1801 Regency Blvd
- 1708 Regency Blvd
- 1605 Queensbury Rd
- 1525 Tudor Dr
- 1805 Regency Blvd
- 1520 Tudor Dr
- 1810 Regency Blvd
- 1609 Queensbury Rd
Your Personal Tour Guide
Ask me questions while you tour the home.