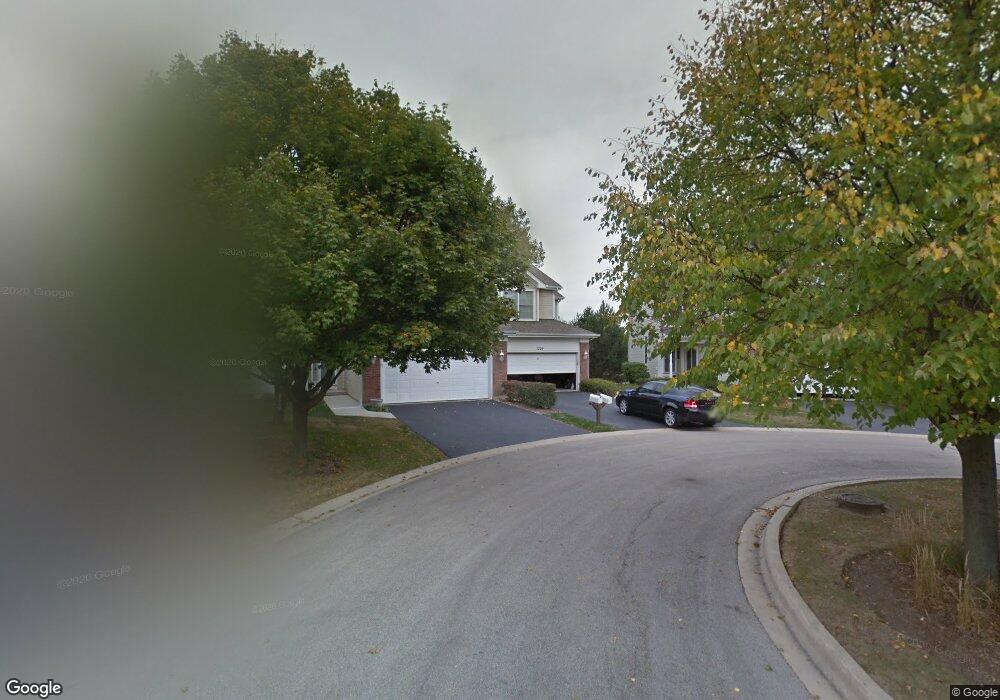
1720 Waverly Cir Unit 2 Saint Charles, IL 60174
Northeast Saint Charles NeighborhoodEstimated Value: $424,191 - $479,000
2
Beds
3
Baths
1,550
Sq Ft
$290/Sq Ft
Est. Value
About This Home
This home is located at 1720 Waverly Cir Unit 2, Saint Charles, IL 60174 and is currently estimated at $449,798, approximately $290 per square foot. 1720 Waverly Cir Unit 2 is a home located in Kane County with nearby schools including Munhall Elementary School, Wredling Middle School, and St Charles East High School.
Ownership History
Date
Name
Owned For
Owner Type
Purchase Details
Closed on
Mar 19, 2019
Sold by
Argelith Ceramic Tiles Inc
Bought by
Dellafranco Susan B
Current Estimated Value
Home Financials for this Owner
Home Financials are based on the most recent Mortgage that was taken out on this home.
Original Mortgage
$274,550
Outstanding Balance
$243,057
Interest Rate
4.75%
Mortgage Type
New Conventional
Estimated Equity
$206,741
Purchase Details
Closed on
Jun 9, 2008
Sold by
Michel Julia J and Singer John A
Bought by
Argelith Ceramic Tiles Inc
Purchase Details
Closed on
Jul 17, 2003
Sold by
Patnaude Edmond T
Bought by
Singer John A and Michel Julia J
Purchase Details
Closed on
Aug 7, 1995
Sold by
Sho Deen Inc
Bought by
Patnaude Edmond T and Patnaude Margaret M
Home Financials for this Owner
Home Financials are based on the most recent Mortgage that was taken out on this home.
Original Mortgage
$125,000
Interest Rate
7.51%
Create a Home Valuation Report for This Property
The Home Valuation Report is an in-depth analysis detailing your home's value as well as a comparison with similar homes in the area
Home Values in the Area
Average Home Value in this Area
Purchase History
| Date | Buyer | Sale Price | Title Company |
|---|---|---|---|
| Dellafranco Susan B | $289,000 | First American Title | |
| Argelith Ceramic Tiles Inc | $302,000 | Fox Title Company | |
| Singer John A | $259,500 | Fox Title Company | |
| Patnaude Edmond T | $199,000 | Chicago Title Insurance Co |
Source: Public Records
Mortgage History
| Date | Status | Borrower | Loan Amount |
|---|---|---|---|
| Open | Dellafranco Susan B | $274,550 | |
| Previous Owner | Patnaude Edmond T | $125,000 |
Source: Public Records
Tax History Compared to Growth
Tax History
| Year | Tax Paid | Tax Assessment Tax Assessment Total Assessment is a certain percentage of the fair market value that is determined by local assessors to be the total taxable value of land and additions on the property. | Land | Improvement |
|---|---|---|---|---|
| 2024 | $8,005 | $115,841 | $33,888 | $81,953 |
| 2023 | $7,658 | $103,679 | $30,330 | $73,349 |
| 2022 | $7,574 | $99,805 | $31,894 | $67,911 |
| 2021 | $7,270 | $95,134 | $30,401 | $64,733 |
| 2020 | $7,190 | $93,360 | $29,834 | $63,526 |
| 2019 | $7,553 | $91,511 | $29,243 | $62,268 |
| 2018 | $7,502 | $90,439 | $29,611 | $60,828 |
| 2017 | $7,319 | $87,347 | $28,599 | $58,748 |
| 2016 | $7,699 | $84,280 | $27,595 | $56,685 |
| 2015 | -- | $82,401 | $27,297 | $55,104 |
| 2014 | -- | $79,461 | $27,297 | $52,164 |
| 2013 | -- | $83,097 | $27,570 | $55,527 |
Source: Public Records
Map
Nearby Homes
- 1919 Waverly Cir
- 820 Derby Course
- Lot 1 in Block 2 Norway Maple Addition To St Charles
- Lot 4 Mosedale St
- Lot 2 in Block 2 Norway Maple Addition To St Charles
- 33 Stirrup Cup Ct
- 12 Highgate Ct
- 1309 Fox Chase Blvd
- 92 Whittington Course
- 55 Whittington Course
- 740 Courtyard Dr
- 2450 Persimmon Dr
- 615 Marion Ave
- 875 Country Club Rd
- lot 012 Tuscola Ave
- 1572 Dempsey Dr
- 1034 N 5th Ave
- 3112 Turnberry Rd
- 1501 Dempsey Dr
- 444 Lakeshore Ct
- 1720 Waverly Cir
- 1722 Waverly Cir
- 1718 Waverly Cir
- 1716 Waverly Cir
- 1802 Waverly Cir
- 1802 Waverly Cir Unit 1802
- 1714 Waverly Cir Unit 1914
- 1804 Waverly Cir
- 1712 Waverly Cir
- 313 Dunham Place Commons
- 1806 Waverly Cir
- 311 Dunham Place Commons Unit 311
- 316 Dunham Place Commons Unit 316
- 318 Dunham Place Commons Unit 318
- 314 Dunham Place Commons
- 312 Dunham Place Commons Unit 312
- 317 Dunham Place Commons
- 315 Dunham Place Commons
- 316 Dunham Place Commons Unit 316
- 312 Dunham Place Commons Unit 312