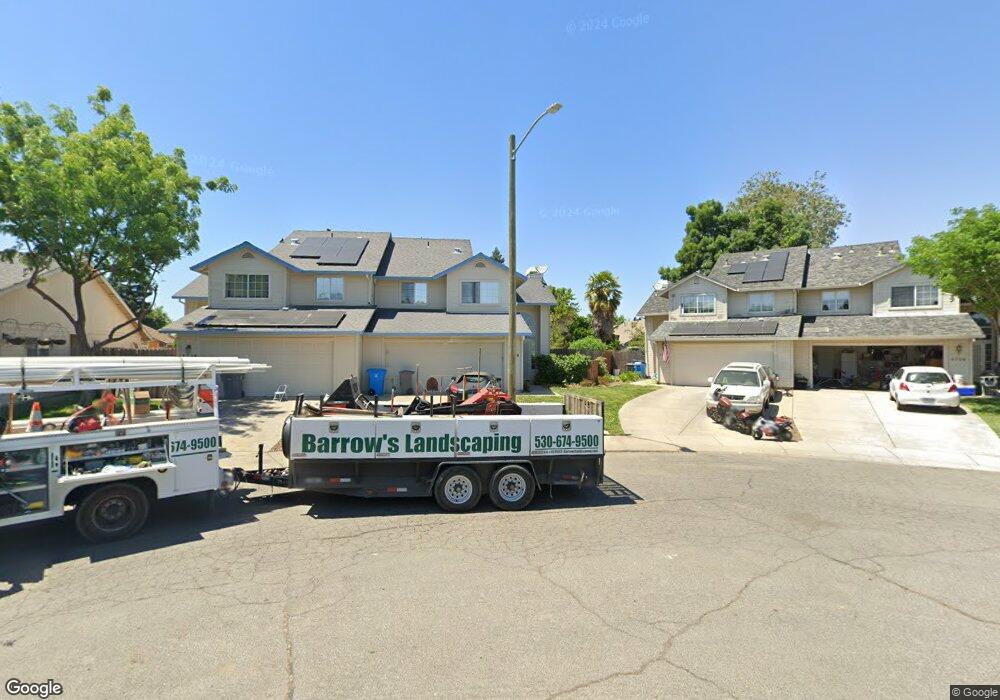
1720 Wildflower Cir Yuba City, CA 95993
Estimated Value: $255,000 - $383,008
3
Beds
3
Baths
1,386
Sq Ft
$242/Sq Ft
Est. Value
About This Home
This home is located at 1720 Wildflower Cir, Yuba City, CA 95993 and is currently estimated at $335,502, approximately $242 per square foot. 1720 Wildflower Cir is a home located in Sutter County with nearby schools including Andros Karperos, River Valley High School, and Pathways Charter Academy.
Ownership History
Date
Name
Owned For
Owner Type
Purchase Details
Closed on
Feb 17, 2021
Sold by
Hlavinka Lonnie A and Hlavinka Sonya R
Bought by
Hlavinka Lonnie Allen and Hlavinka Sonya Rena
Current Estimated Value
Home Financials for this Owner
Home Financials are based on the most recent Mortgage that was taken out on this home.
Original Mortgage
$175,000
Outstanding Balance
$156,383
Interest Rate
2.65%
Mortgage Type
New Conventional
Estimated Equity
$179,119
Purchase Details
Closed on
Dec 22, 2000
Sold by
Eastridge Harold M and Eastridge Margaret M
Bought by
Hlavinka Lonnie A and Hlavinka Sonya R
Home Financials for this Owner
Home Financials are based on the most recent Mortgage that was taken out on this home.
Original Mortgage
$108,503
Interest Rate
7.08%
Mortgage Type
FHA
Create a Home Valuation Report for This Property
The Home Valuation Report is an in-depth analysis detailing your home's value as well as a comparison with similar homes in the area
Home Values in the Area
Average Home Value in this Area
Purchase History
| Date | Buyer | Sale Price | Title Company |
|---|---|---|---|
| Hlavinka Lonnie Allen | -- | Placer Title Company | |
| Hlavinka Lonnie A | $109,500 | Placer Title Company |
Source: Public Records
Mortgage History
| Date | Status | Borrower | Loan Amount |
|---|---|---|---|
| Open | Hlavinka Lonnie Allen | $175,000 | |
| Previous Owner | Hlavinka Lonnie A | $108,503 |
Source: Public Records
Tax History Compared to Growth
Tax History
| Year | Tax Paid | Tax Assessment Tax Assessment Total Assessment is a certain percentage of the fair market value that is determined by local assessors to be the total taxable value of land and additions on the property. | Land | Improvement |
|---|---|---|---|---|
| 2025 | $2,370 | $164,995 | $30,134 | $134,861 |
| 2024 | $2,370 | $161,761 | $29,544 | $132,217 |
| 2023 | $2,370 | $158,590 | $28,965 | $129,625 |
| 2022 | $2,302 | $155,482 | $28,398 | $127,084 |
| 2021 | $2,271 | $152,435 | $27,842 | $124,593 |
| 2020 | $2,244 | $150,873 | $27,557 | $123,316 |
| 2019 | $2,206 | $147,913 | $27,016 | $120,897 |
| 2018 | $2,172 | $145,013 | $26,486 | $118,527 |
| 2017 | $2,132 | $142,169 | $25,967 | $116,202 |
| 2016 | $2,098 | $139,382 | $25,458 | $113,924 |
| 2015 | $2,070 | $137,287 | $25,075 | $112,212 |
| 2014 | $2,042 | $134,598 | $24,584 | $110,014 |
Source: Public Records
Map
Nearby Homes
- 683 Mark Thomas Dr
- 1781 Franklin Rd Unit 36
- 1781 Franklin Rd Unit 59
- 1923 Hardial Dr
- 430 Neil Dr
- 138 Nantucket Way
- 152 College Hill Way
- 170 Nantucket Way
- 156 Bristol Way
- 0 Lassen Blvd
- 1665 Michelle Dr
- 955 Carson Dr
- 1955 Jason Ct
- 1514 Countryside Dr
- 238 Anita Way
- 1344 Kean Ave
- 1330 Kean Ave
- 1545 Camino Del Oro
- 4520 Us-99
- 0 Us-99
- 1718 Wildflower Cir
- 1726 Wildflower Cir
- 1728 Wildflower Cir
- 1714 Wildflower Cir
- 567 Willowbrook Dr
- 1733 Wildflower Cir
- 559 Willowbrook Dr
- 575 Willowbrook Dr
- 1712 Wildflower Cir
- 1735 Wildflower Cir
- 551 Willowbrook Dr
- 583 Willowbrook Dr
- 1741 Wildflower Cir
- 1706 Wildflower Cir
- 541 Willowbrook Dr
- 1715 Wildflower Cir
- 591 Willowbrook Dr
- 1710 Bridge St
- 1743 Wildflower Cir
- 1704 Wildflower Cir