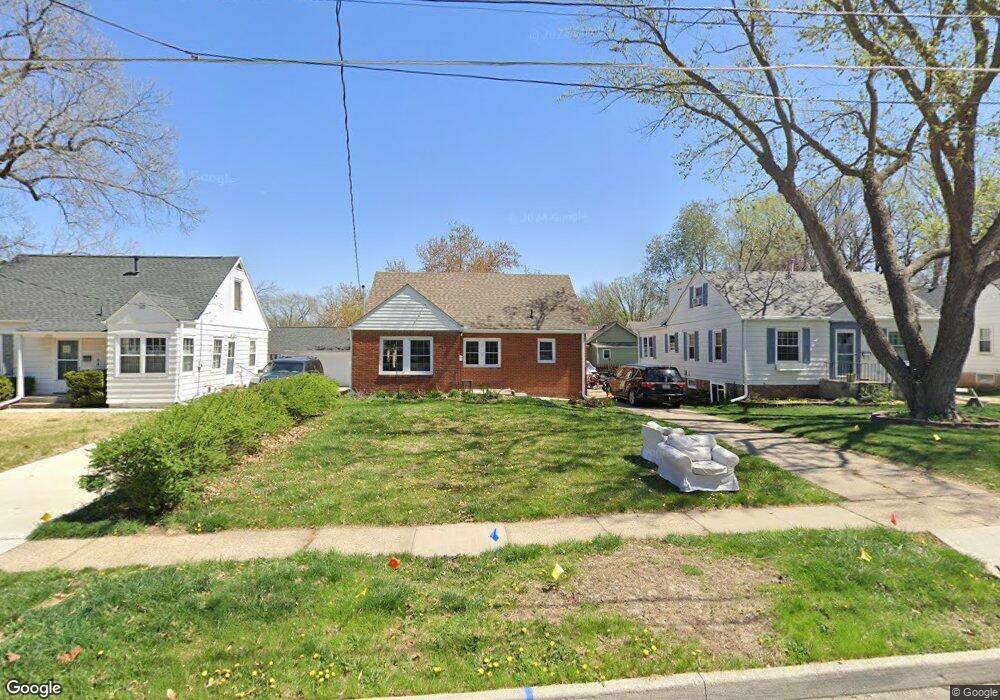
1721 47th St Des Moines, IA 50310
Waveland Park NeighborhoodEstimated Value: $207,000 - $238,000
3
Beds
1
Bath
1,110
Sq Ft
$203/Sq Ft
Est. Value
About This Home
This home is located at 1721 47th St, Des Moines, IA 50310 and is currently estimated at $225,152, approximately $202 per square foot. 1721 47th St is a home located in Polk County with nearby schools including Perkins Elementary School, Merrill Middle School, and Roosevelt High School.
Ownership History
Date
Name
Owned For
Owner Type
Purchase Details
Closed on
Feb 25, 2011
Sold by
American General Financial Services Inc
Bought by
Triple Lc Properties Llc
Current Estimated Value
Home Financials for this Owner
Home Financials are based on the most recent Mortgage that was taken out on this home.
Original Mortgage
$100,000
Outstanding Balance
$69,426
Interest Rate
5.09%
Mortgage Type
Credit Line Revolving
Estimated Equity
$155,726
Purchase Details
Closed on
Sep 30, 2010
Sold by
Barrett Edward Joseph
Bought by
American General Financial Services Inc
Create a Home Valuation Report for This Property
The Home Valuation Report is an in-depth analysis detailing your home's value as well as a comparison with similar homes in the area
Home Values in the Area
Average Home Value in this Area
Purchase History
| Date | Buyer | Sale Price | Title Company |
|---|---|---|---|
| Triple Lc Properties Llc | $76,500 | None Available | |
| American General Financial Services Inc | $109,826 | None Available |
Source: Public Records
Mortgage History
| Date | Status | Borrower | Loan Amount |
|---|---|---|---|
| Open | Triple Lc Properties Llc | $100,000 |
Source: Public Records
Tax History Compared to Growth
Tax History
| Year | Tax Paid | Tax Assessment Tax Assessment Total Assessment is a certain percentage of the fair market value that is determined by local assessors to be the total taxable value of land and additions on the property. | Land | Improvement |
|---|---|---|---|---|
| 2025 | $3,756 | $211,900 | $49,100 | $162,800 |
| 2024 | $3,756 | $190,900 | $43,500 | $147,400 |
| 2023 | $3,856 | $190,900 | $43,500 | $147,400 |
| 2022 | $3,826 | $163,600 | $38,500 | $125,100 |
| 2021 | $3,889 | $163,600 | $38,500 | $125,100 |
| 2020 | $3,904 | $150,600 | $35,100 | $115,500 |
| 2019 | $3,606 | $150,600 | $35,100 | $115,500 |
| 2018 | $3,570 | $134,200 | $30,700 | $103,500 |
| 2017 | $3,308 | $134,200 | $30,700 | $103,500 |
| 2016 | $3,222 | $122,300 | $27,500 | $94,800 |
| 2015 | $3,222 | $122,300 | $27,500 | $94,800 |
| 2014 | $3,006 | $113,100 | $25,100 | $88,000 |
Source: Public Records
Map
Nearby Homes