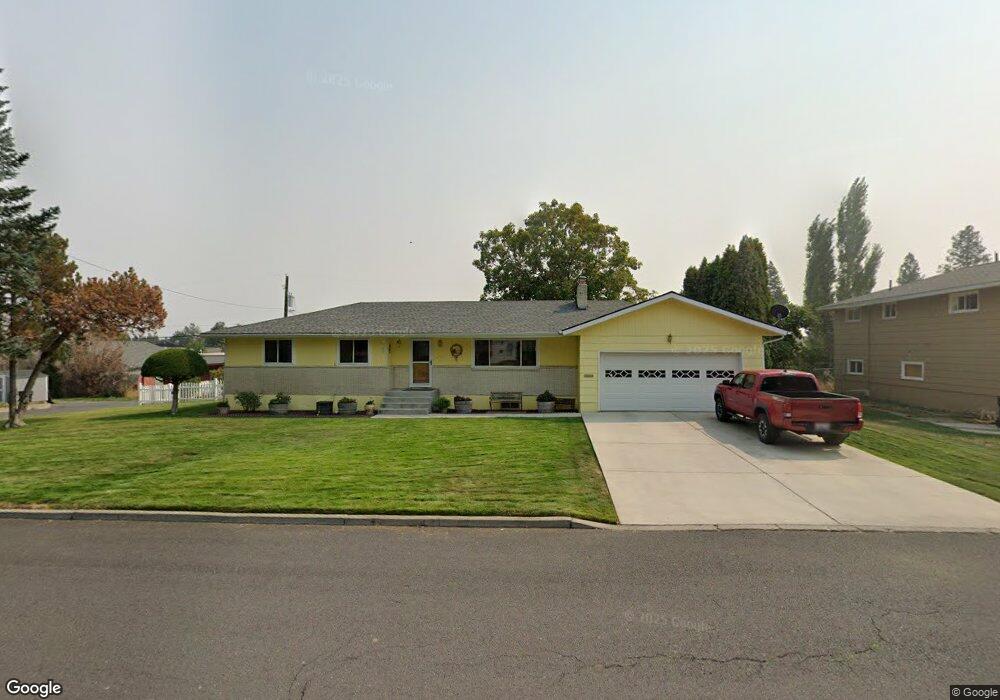
1721 4th St Cheney, WA 99004
Estimated Value: $390,000 - $432,000
3
Beds
3
Baths
2,492
Sq Ft
$165/Sq Ft
Est. Value
About This Home
This home is located at 1721 4th St, Cheney, WA 99004 and is currently estimated at $412,111, approximately $165 per square foot. 1721 4th St is a home located in Spokane County with nearby schools including Betz Elementary School, Cheney Middle School, and Cheney High School.
Ownership History
Date
Name
Owned For
Owner Type
Purchase Details
Closed on
Aug 7, 1996
Sold by
White Richard J and White Catherine V
Bought by
Swegle Richard D and Swegle Cindy L
Current Estimated Value
Home Financials for this Owner
Home Financials are based on the most recent Mortgage that was taken out on this home.
Original Mortgage
$112,781
Outstanding Balance
$8,891
Interest Rate
8.18%
Mortgage Type
FHA
Estimated Equity
$403,220
Create a Home Valuation Report for This Property
The Home Valuation Report is an in-depth analysis detailing your home's value as well as a comparison with similar homes in the area
Purchase History
We collect this data history from publicly available records. To have your information removed, we recommend requesting removal directly through your county’s website.
| Date | Buyer | Sale Price | Title Company |
|---|---|---|---|
| Swegle Richard D | $113,500 | Spokane County Title |
Source: Public Records
Mortgage History
We collect this data history from publicly available records. To have your information removed, we recommend requesting removal directly through your county’s website.
| Date | Status | Borrower | Loan Amount |
|---|---|---|---|
| Open | Swegle Richard D | $112,781 |
Source: Public Records
Tax History
| Year | Tax Paid | Tax Assessment Tax Assessment Total Assessment is a certain percentage of the fair market value that is determined by local assessors to be the total taxable value of land and additions on the property. | Land | Improvement |
|---|---|---|---|---|
| 2025 | $3,654 | $351,900 | $80,000 | $271,900 |
| 2024 | $3,654 | $331,400 | $80,000 | $251,400 |
| 2023 | $2,969 | $331,400 | $80,000 | $251,400 |
| 2022 | $2,836 | $354,300 | $80,000 | $274,300 |
| 2021 | $2,857 | $249,800 | $42,000 | $207,800 |
| 2020 | $2,828 | $231,800 | $40,000 | $191,800 |
| 2019 | $2,401 | $206,900 | $40,000 | $166,900 |
| 2018 | $2,640 | $198,100 | $40,000 | $158,100 |
| 2017 | $2,263 | $187,600 | $40,000 | $147,600 |
| 2016 | $2,169 | $173,200 | $40,000 | $133,200 |
| 2015 | $2,092 | $169,900 | $40,000 | $129,900 |
| 2014 | -- | $169,900 | $40,000 | $129,900 |
| 2013 | -- | $0 | $0 | $0 |
Source: Public Records
Map
Nearby Homes
- 1626 5th St
- 1717 2nd St
- 1820 5th St
- 1521 4th St
- 302 Apple Tree Ct
- 302 Peach Tree Ct
- 302 Plum Tree Ct
- 314 Plum Tree Ct Unit Lot 20 Block 3 - Sno
- 2319 Annie Place
- 318 Plum Tree Ct Unit Lot 10 Block 3 - Sno
- 307 Peach Tree Ct
- 301 Plum Tree Ct Unit Lot 6 Block 3 - Snow
- 323 Peach Tree Ct
- 313 Apple Tree Ct
- 305 Plum Tree Ct Unit Lot 17 Block 3 - Wat
- 317 Peach Tree Ct
- 1239 1st St
- 2402 Annie Place
- 2331 Annie Place Unit Lot 12 Block 3 - Sno
- 2323 Annie Place Unit Lot 13 Block 3 - Wat
Your Personal Tour Guide
Ask me questions while you tour the home.