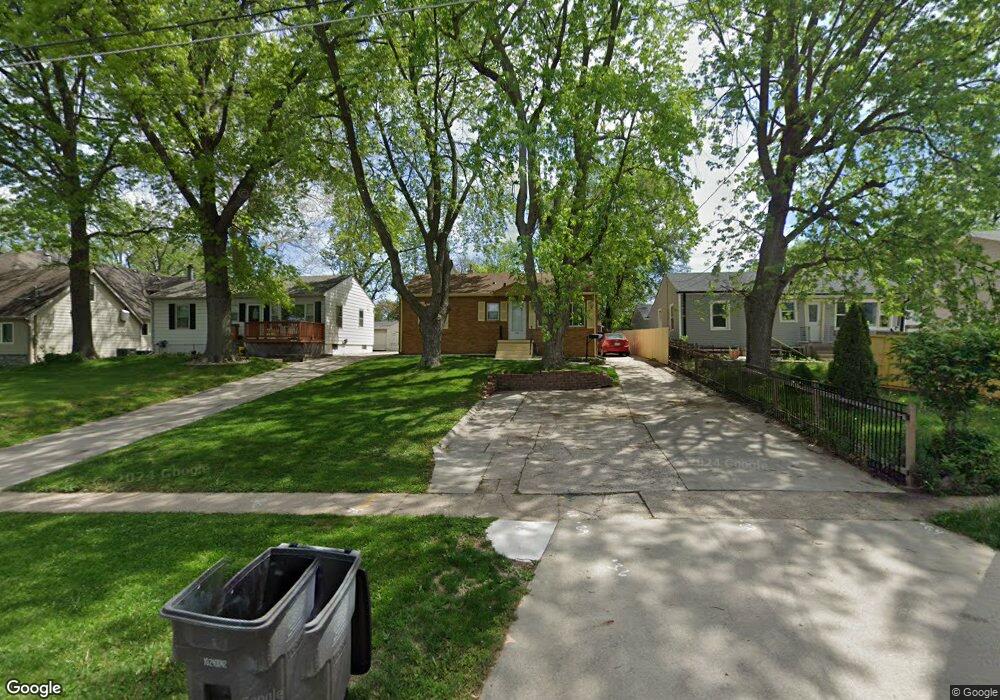
1721 63rd St Des Moines, IA 50322
Merle Hay NeighborhoodEstimated Value: $196,000 - $228,042
3
Beds
2
Baths
864
Sq Ft
$240/Sq Ft
Est. Value
About This Home
This home is located at 1721 63rd St, Des Moines, IA 50322 and is currently estimated at $207,511, approximately $240 per square foot. 1721 63rd St is a home located in Polk County with nearby schools including Cowles Elementary School, Merrill Middle School, and Roosevelt High School.
Ownership History
Date
Name
Owned For
Owner Type
Purchase Details
Closed on
Mar 30, 2021
Sold by
Nakata Haruko and Fuentes Oscar D
Bought by
Nakata Haruko and Fuentes Oscar D
Current Estimated Value
Home Financials for this Owner
Home Financials are based on the most recent Mortgage that was taken out on this home.
Original Mortgage
$80,000
Outstanding Balance
$71,796
Interest Rate
2.9%
Mortgage Type
New Conventional
Estimated Equity
$135,715
Purchase Details
Closed on
Nov 25, 2009
Sold by
Dynamic Enterprises Corporation
Bought by
Nakata Haruko
Home Financials for this Owner
Home Financials are based on the most recent Mortgage that was taken out on this home.
Original Mortgage
$106,043
Interest Rate
5.05%
Mortgage Type
FHA
Purchase Details
Closed on
Jul 13, 2009
Sold by
The Secretary Of Housing & Urban Develop
Bought by
Dynamic Enterprises Corporation
Purchase Details
Closed on
Nov 30, 2007
Sold by
Wells Fargo Bank Na
Bought by
Secretary Of Housing & Urban Development
Purchase Details
Closed on
Nov 29, 2007
Sold by
Fuller Jessica Nicole and Fuller Kevin L
Bought by
Wells Fargo Bank Na
Purchase Details
Closed on
Aug 3, 2005
Sold by
Mulic Mirsad and Mulic Admira
Bought by
Shaw Jessica N and Fuller Kevin L
Home Financials for this Owner
Home Financials are based on the most recent Mortgage that was taken out on this home.
Original Mortgage
$116,176
Interest Rate
5.71%
Mortgage Type
FHA
Purchase Details
Closed on
Dec 7, 2000
Sold by
Johnson Steven A and Johnson Cheryl L
Bought by
Mulic Mirsad and Mulic Admira
Home Financials for this Owner
Home Financials are based on the most recent Mortgage that was taken out on this home.
Original Mortgage
$85,956
Interest Rate
7.83%
Mortgage Type
FHA
Purchase Details
Closed on
Jun 21, 1997
Sold by
Bogaards Karen K and Frank Karen K
Bought by
Johnson Steven A and Johnson Cheryl L
Home Financials for this Owner
Home Financials are based on the most recent Mortgage that was taken out on this home.
Original Mortgage
$72,393
Interest Rate
8%
Mortgage Type
FHA
Create a Home Valuation Report for This Property
The Home Valuation Report is an in-depth analysis detailing your home's value as well as a comparison with similar homes in the area
Home Values in the Area
Average Home Value in this Area
Purchase History
| Date | Buyer | Sale Price | Title Company |
|---|---|---|---|
| Nakata Haruko | $1,000 | None Listed On Document | |
| Nakata Haruko | $107,500 | Itc | |
| Dynamic Enterprises Corporation | -- | None Available | |
| Secretary Of Housing & Urban Development | $129,000 | None Available | |
| Wells Fargo Bank Na | $129,182 | None Available | |
| Shaw Jessica N | $117,500 | -- | |
| Mulic Mirsad | $85,500 | -- | |
| Johnson Steven A | $72,000 | -- |
Source: Public Records
Mortgage History
| Date | Status | Borrower | Loan Amount |
|---|---|---|---|
| Open | Nakata Haruko | $80,000 | |
| Previous Owner | Nakata Haruko | $106,043 | |
| Previous Owner | Shaw Jessica N | $116,176 | |
| Previous Owner | Mulic Mirsad | $85,956 | |
| Previous Owner | Johnson Steven A | $72,393 |
Source: Public Records
Tax History Compared to Growth
Tax History
| Year | Tax Paid | Tax Assessment Tax Assessment Total Assessment is a certain percentage of the fair market value that is determined by local assessors to be the total taxable value of land and additions on the property. | Land | Improvement |
|---|---|---|---|---|
| 2025 | $3,532 | $212,700 | $43,900 | $168,800 |
| 2024 | $3,532 | $190,000 | $38,700 | $151,300 |
| 2023 | $3,688 | $190,000 | $38,700 | $151,300 |
| 2022 | $3,658 | $165,400 | $34,900 | $130,500 |
| 2021 | $3,438 | $165,400 | $34,900 | $130,500 |
| 2020 | $3,568 | $146,400 | $31,100 | $115,300 |
| 2019 | $3,278 | $146,400 | $31,100 | $115,300 |
| 2018 | $3,240 | $130,500 | $27,100 | $103,400 |
| 2017 | $2,896 | $130,500 | $27,100 | $103,400 |
| 2016 | $2,816 | $115,600 | $23,700 | $91,900 |
| 2015 | $2,816 | $115,600 | $23,700 | $91,900 |
| 2014 | $2,550 | $104,700 | $21,000 | $83,700 |
Source: Public Records
Map
Nearby Homes