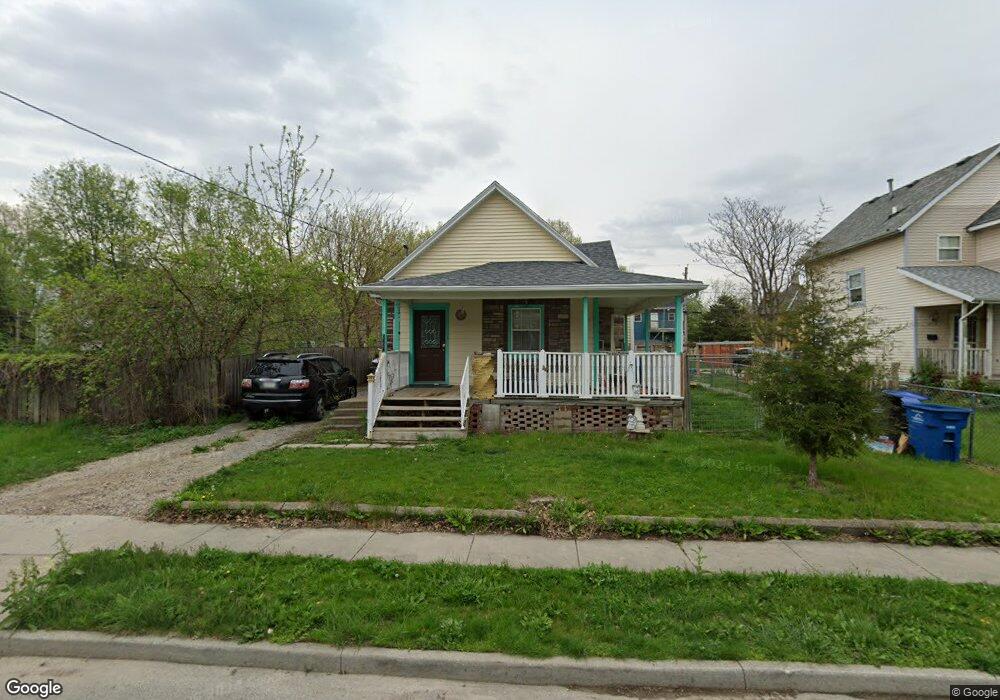
1721 8th St Des Moines, IA 50314
River Bend NeighborhoodEstimated Value: $116,569 - $167,000
3
Beds
1
Bath
1,270
Sq Ft
$104/Sq Ft
Est. Value
About This Home
This home is located at 1721 8th St, Des Moines, IA 50314 and is currently estimated at $131,892, approximately $103 per square foot. 1721 8th St is a home located in Polk County with nearby schools including Moulton Elementary School, Harding Middle School, and North High School.
Ownership History
Date
Name
Owned For
Owner Type
Purchase Details
Closed on
Dec 2, 2015
Sold by
Montero Reyna and Montero Antonio
Bought by
Elias Ines San and Delafuente Ines
Current Estimated Value
Purchase Details
Closed on
Mar 21, 2005
Sold by
Ortega Reyna and Aguilar Reyna
Bought by
Aguilar Reyna
Purchase Details
Closed on
Aug 13, 2004
Sold by
Ortega Juan J
Bought by
Ortega Reyna
Purchase Details
Closed on
Aug 15, 2003
Sold by
Ortega Reyna
Bought by
Ortega Juan J
Purchase Details
Closed on
Oct 12, 2001
Sold by
Aguilar Alicia M
Bought by
Ortega Reyna
Create a Home Valuation Report for This Property
The Home Valuation Report is an in-depth analysis detailing your home's value as well as a comparison with similar homes in the area
Home Values in the Area
Average Home Value in this Area
Purchase History
| Date | Buyer | Sale Price | Title Company |
|---|---|---|---|
| Elias Ines San | $36,500 | None Available | |
| Aguilar Reyna | -- | -- | |
| Ortega Reyna | -- | -- | |
| Ortega Juan J | -- | -- | |
| Ortega Reyna | $19,500 | -- |
Source: Public Records
Tax History Compared to Growth
Tax History
| Year | Tax Paid | Tax Assessment Tax Assessment Total Assessment is a certain percentage of the fair market value that is determined by local assessors to be the total taxable value of land and additions on the property. | Land | Improvement |
|---|---|---|---|---|
| 2025 | $1,012 | $70,000 | $9,800 | $60,200 |
| 2024 | $1,012 | $61,900 | $8,700 | $53,200 |
| 2023 | $874 | $61,900 | $8,700 | $53,200 |
| 2022 | $866 | $46,000 | $6,700 | $39,300 |
| 2021 | $792 | $46,000 | $6,700 | $39,300 |
| 2020 | $816 | $40,300 | $5,900 | $34,400 |
| 2019 | $580 | $40,300 | $5,900 | $34,400 |
| 2018 | $568 | $30,100 | $5,700 | $24,400 |
| 2017 | $508 | $30,100 | $5,700 | $24,400 |
| 2016 | $490 | $27,300 | $5,100 | $22,200 |
| 2015 | $490 | $27,300 | $5,100 | $22,200 |
| 2014 | $472 | $26,500 | $5,100 | $21,400 |
Source: Public Records
Map
Nearby Homes