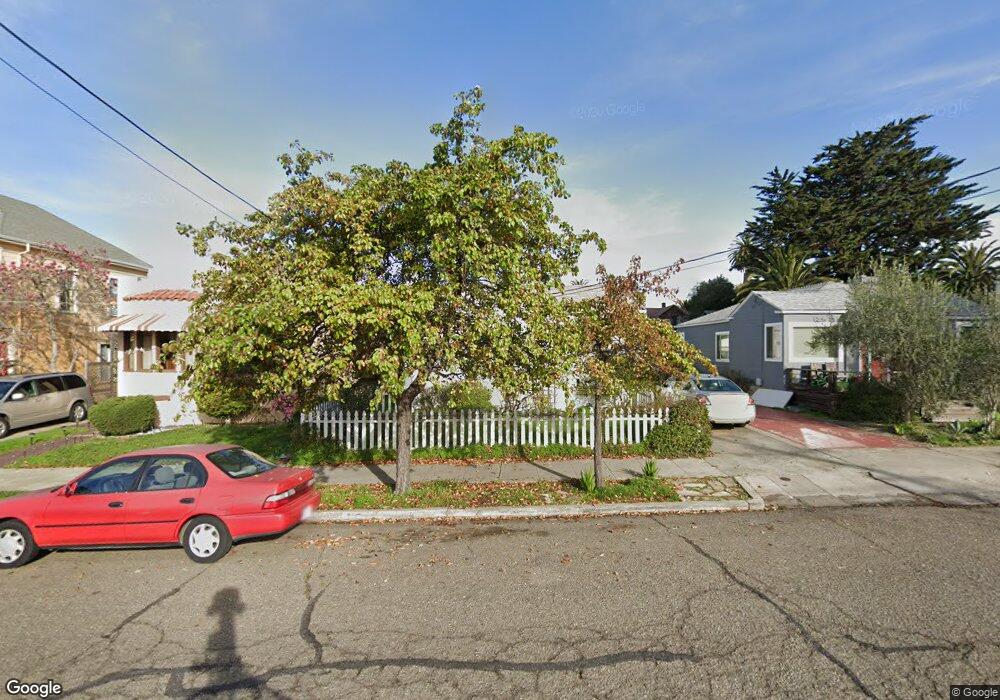
1721 Derby St Berkeley, CA 94703
South Berkeley NeighborhoodEstimated Value: $1,064,000 - $1,255,000
2
Beds
1
Bath
1,008
Sq Ft
$1,117/Sq Ft
Est. Value
About This Home
This home is located at 1721 Derby St, Berkeley, CA 94703 and is currently estimated at $1,126,262, approximately $1,117 per square foot. 1721 Derby St is a home located in Alameda County with nearby schools including Malcolm X Elementary School, Emerson Elementary School, and John Muir Elementary School.
Ownership History
Date
Name
Owned For
Owner Type
Purchase Details
Closed on
Aug 16, 2010
Sold by
Dutiel Cheri E
Bought by
Dutiel Cheri and The Cheri Dutiel Trust
Current Estimated Value
Purchase Details
Closed on
Oct 7, 2003
Sold by
Dutiel Cheri E
Bought by
Dutiel Cheri E and Dutiel Marguery
Home Financials for this Owner
Home Financials are based on the most recent Mortgage that was taken out on this home.
Original Mortgage
$122,990
Interest Rate
5.98%
Mortgage Type
Stand Alone First
Create a Home Valuation Report for This Property
The Home Valuation Report is an in-depth analysis detailing your home's value as well as a comparison with similar homes in the area
Home Values in the Area
Average Home Value in this Area
Purchase History
| Date | Buyer | Sale Price | Title Company |
|---|---|---|---|
| Dutiel Cheri | -- | None Available | |
| Dutiel Cheri E | $61,500 | First American Title Company |
Source: Public Records
Mortgage History
| Date | Status | Borrower | Loan Amount |
|---|---|---|---|
| Closed | Dutiel Cheri E | $122,990 |
Source: Public Records
Tax History
| Year | Tax Paid | Tax Assessment Tax Assessment Total Assessment is a certain percentage of the fair market value that is determined by local assessors to be the total taxable value of land and additions on the property. | Land | Improvement |
|---|---|---|---|---|
| 2025 | $6,735 | $311,290 | $95,487 | $222,803 |
| 2024 | $6,735 | $305,048 | $93,614 | $218,434 |
| 2023 | $6,528 | $305,931 | $91,779 | $214,152 |
| 2022 | $6,542 | $292,933 | $89,980 | $209,953 |
| 2021 | $6,535 | $287,053 | $88,216 | $205,837 |
| 2020 | $6,210 | $291,037 | $87,311 | $203,726 |
| 2019 | $5,967 | $285,331 | $85,599 | $199,732 |
| 2018 | $5,829 | $279,737 | $83,921 | $195,816 |
| 2017 | $5,600 | $274,253 | $82,276 | $191,977 |
| 2016 | $5,470 | $268,876 | $80,663 | $188,213 |
| 2015 | $5,377 | $264,838 | $79,451 | $185,387 |
| 2014 | $5,260 | $259,651 | $77,895 | $181,756 |
Source: Public Records
Map
Nearby Homes
- 1634 Blake St
- 1612 Parker St
- 2701 Grant St
- 1645 Dwight Way
- 1604 Dwight Way
- 1901 Parker St Unit 3
- 1515 Derby St
- 2829 California St
- 2750 Sacramento St
- 1450 Ward St
- 2758 Sacramento St
- 2774 Sacramento St
- 2782 Sacramento St
- 2790 Sacramento St
- 2018 Blake St
- 2926 Ellis St
- 1535 Julia St
- 2350 Sacramento St
- 1646 Ashby Ave
- 2922 Stanton St
Your Personal Tour Guide
Ask me questions while you tour the home.