1721 E Valley Rd Montecito, CA 93108
Estimated Value: $6,510,197 - $8,333,000
2
Beds
3
Baths
2,780
Sq Ft
$2,626/Sq Ft
Est. Value
About This Home
This home is located at 1721 E Valley Rd, Montecito, CA 93108 and is currently estimated at $7,301,299, approximately $2,626 per square foot. 1721 E Valley Rd is a home located in Santa Barbara County with nearby schools including Santa Barbara Junior High School, Santa Barbara Senior High School, and Our Lady of Mount Carmel School.
Ownership History
Date
Name
Owned For
Owner Type
Purchase Details
Closed on
Jul 21, 2025
Sold by
Bianchi Family Trust and Bianchi Adam
Bought by
Bianchi Family Trust and Bianchi
Current Estimated Value
Home Financials for this Owner
Home Financials are based on the most recent Mortgage that was taken out on this home.
Original Mortgage
$10,500,000
Outstanding Balance
$10,499,350
Interest Rate
6.77%
Mortgage Type
Reverse Mortgage Home Equity Conversion Mortgage
Estimated Equity
-$3,198,051
Purchase Details
Closed on
Jun 3, 1997
Sold by
Argyropoulos and Sarah
Bought by
Bianchi Adam and Bianchi Penelope W
Purchase Details
Closed on
Dec 24, 1993
Sold by
Devorzon Barry R and Devorzon Jelinda M
Bought by
Argyropoulos James and Argyropoulos Sarah
Home Financials for this Owner
Home Financials are based on the most recent Mortgage that was taken out on this home.
Original Mortgage
$280,000
Interest Rate
7.09%
Mortgage Type
Seller Take Back
Create a Home Valuation Report for This Property
The Home Valuation Report is an in-depth analysis detailing your home's value as well as a comparison with similar homes in the area
Home Values in the Area
Average Home Value in this Area
Purchase History
| Date | Buyer | Sale Price | Title Company |
|---|---|---|---|
| Bianchi Family Trust | -- | Fnc Title | |
| Bianchi Adam | -- | Chicago Title Co | |
| Argyropoulos James | $280,000 | Chicago Title |
Source: Public Records
Mortgage History
| Date | Status | Borrower | Loan Amount |
|---|---|---|---|
| Open | Bianchi Family Trust | $10,500,000 | |
| Previous Owner | Argyropoulos James | $280,000 |
Source: Public Records
Tax History
| Year | Tax Paid | Tax Assessment Tax Assessment Total Assessment is a certain percentage of the fair market value that is determined by local assessors to be the total taxable value of land and additions on the property. | Land | Improvement |
|---|---|---|---|---|
| 2025 | $29,423 | $2,732,263 | $1,656,383 | $1,075,880 |
| 2023 | $29,423 | $2,626,167 | $1,592,064 | $1,034,103 |
| 2022 | $28,555 | $2,574,675 | $1,560,848 | $1,013,827 |
| 2021 | $27,984 | $2,524,193 | $1,530,244 | $993,949 |
| 2020 | $27,725 | $2,498,312 | $1,514,554 | $983,758 |
| 2019 | $20,463 | $1,833,660 | $1,147,512 | $686,148 |
| 2018 | $18,247 | $1,618,922 | $946,227 | $672,695 |
| 2017 | $25,796 | $2,354,226 | $1,427,208 | $927,018 |
| 2016 | $25,008 | $2,308,066 | $1,399,224 | $908,842 |
| 2015 | $24,501 | $2,273,398 | $1,378,207 | $895,191 |
| 2014 | -- | $2,228,866 | $1,351,210 | $877,656 |
Source: Public Records
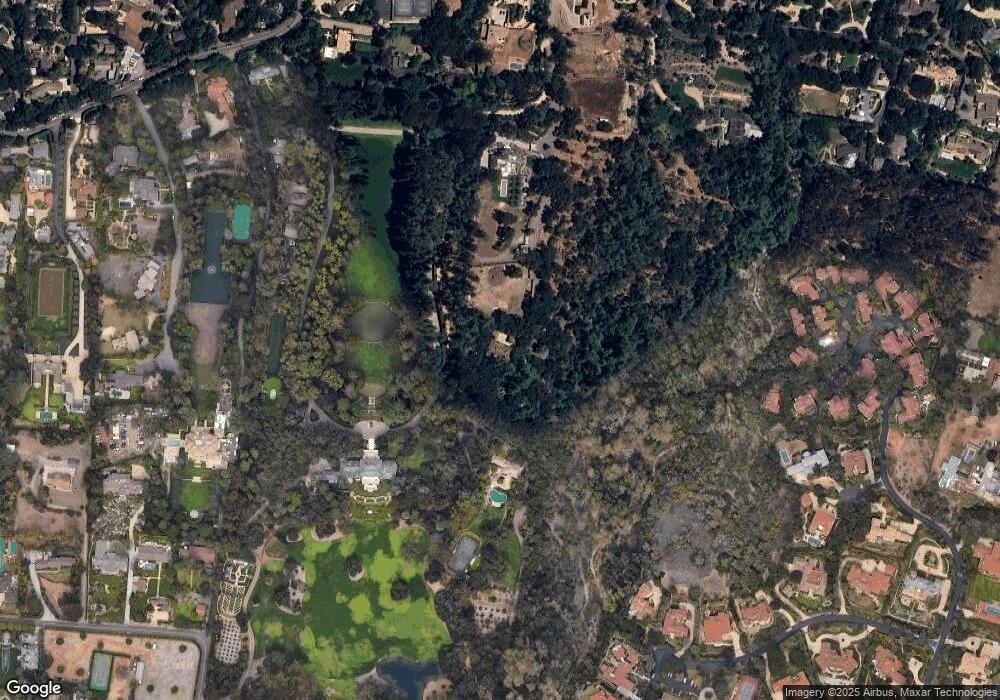
Map
Nearby Homes
- 485 Monarch Ln
- 1725 E Valley Rd
- 420 Seaview Rd
- 1850 Jelinda Dr
- 1988 Inverness Ln
- 526 Crocker Sperry Dr
- 240 Miramar Ave
- 650 San Ysidro Rd
- 2010 Birnam Wood Dr
- 1445 School House Rd
- 601 San Ysidro Rd
- 610 Olive Rd
- 2069 China Flat Rd
- 510 Mclean Ln
- 99 La Vuelta Rd
- 284 Gould Ln
- 1381 E Valley Rd
- 2125 Birnam Wood Dr
- 1932 N Jameson Ln Unit B
- 1940 N Jameson Ln Unit A
- 1721 E Valley Rd
- 1719 E Valley Rd
- 1719 E Valley Rd
- 1600-1700 East Valley
- 1715 E Valley Rd
- 1715 E Valley Rd
- 1715 E Valley Rd
- 1715 E Valley Rd
- 1633 E Valley Rd
- 1633 E Valley Rd
- 1711 E Valley Rd
- 1709 E Valley Rd
- 007 E Valley Ln
- 2790 E Valley Ln
- 2985 E Valley Ln
- 2876 E Valley Ln
- 1683 E Valley Rd
- 486 Monarch Ln
- 0000 Toro Canyon Area
- 400-500 Meadowbrook Dr
Your Personal Tour Guide
Ask me questions while you tour the home.