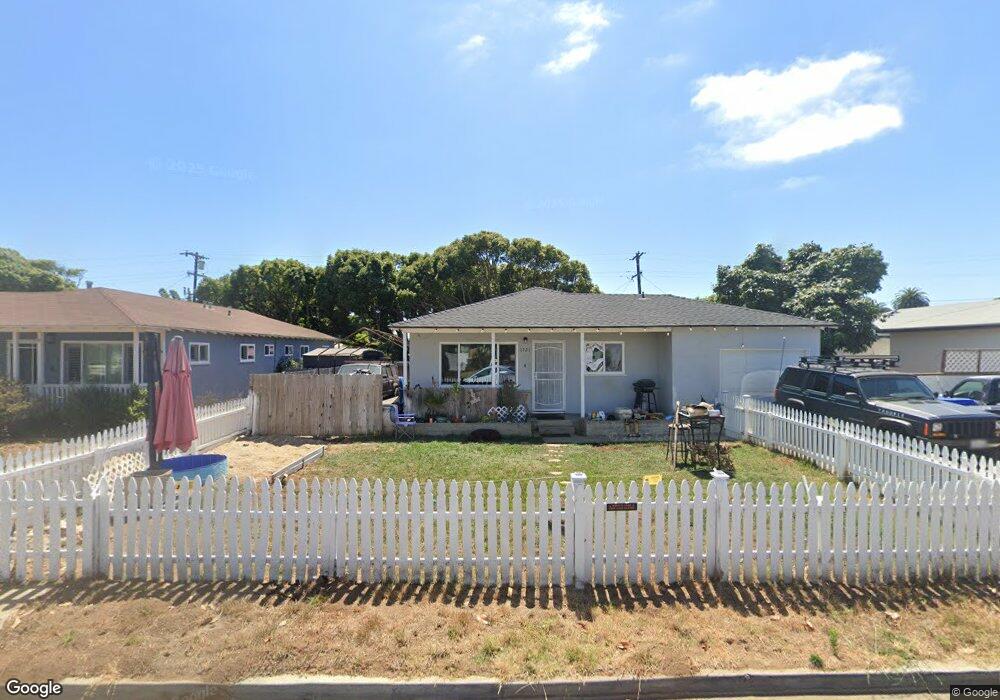
1721 Machado St Oceanside, CA 92054
South Oceanside NeighborhoodEstimated Value: $1,135,412 - $1,700,000
4
Beds
2
Baths
1,296
Sq Ft
$1,068/Sq Ft
Est. Value
About This Home
This home is located at 1721 Machado St, Oceanside, CA 92054 and is currently estimated at $1,384,603, approximately $1,068 per square foot. 1721 Machado St is a home located in San Diego County with nearby schools including South Oceanside Elementary School, Lincoln Middle School, and Oceanside High School.
Ownership History
Date
Name
Owned For
Owner Type
Purchase Details
Closed on
Apr 5, 2021
Sold by
Ranson David E and Ranson Lynda J
Bought by
Rogers Kristopher
Current Estimated Value
Home Financials for this Owner
Home Financials are based on the most recent Mortgage that was taken out on this home.
Original Mortgage
$420,007
Interest Rate
3.1%
Mortgage Type
New Conventional
Purchase Details
Closed on
Jul 26, 2016
Sold by
Ranson David E
Bought by
Ranson David E and Ranson Lynda J
Purchase Details
Closed on
Oct 23, 2012
Sold by
Ranson Betty L
Bought by
Ranson Betty L
Purchase Details
Closed on
Apr 30, 1998
Sold by
Ranson Richard A and Ranson Betty L
Bought by
Ranson Richard A and Ranson Betty L
Home Financials for this Owner
Home Financials are based on the most recent Mortgage that was taken out on this home.
Original Mortgage
$71,500
Interest Rate
7.05%
Create a Home Valuation Report for This Property
The Home Valuation Report is an in-depth analysis detailing your home's value as well as a comparison with similar homes in the area
Home Values in the Area
Average Home Value in this Area
Purchase History
| Date | Buyer | Sale Price | Title Company |
|---|---|---|---|
| Rogers Kristopher | -- | Ticor Title Company Of Ca | |
| Ranson David E | -- | None Available | |
| Ranson David E | -- | None Available | |
| Ranson Betty L | -- | None Available | |
| Ranson Richard A | -- | Gateway Title Company |
Source: Public Records
Mortgage History
| Date | Status | Borrower | Loan Amount |
|---|---|---|---|
| Closed | Rogers Kristopher | $420,007 | |
| Closed | Ranson Richard A | $71,500 |
Source: Public Records
Tax History
| Year | Tax Paid | Tax Assessment Tax Assessment Total Assessment is a certain percentage of the fair market value that is determined by local assessors to be the total taxable value of land and additions on the property. | Land | Improvement |
|---|---|---|---|---|
| 2025 | $6,711 | $613,190 | $503,460 | $109,730 |
| 2024 | $6,711 | $601,168 | $493,589 | $107,579 |
| 2023 | $6,503 | $1,040,400 | $894,744 | $145,656 |
| 2022 | $11,392 | $1,020,000 | $877,200 | $142,800 |
| 2021 | $1,376 | $115,300 | $54,125 | $61,175 |
| 2020 | $1,335 | $114,119 | $53,571 | $60,548 |
| 2019 | $1,298 | $111,882 | $52,521 | $59,361 |
| 2018 | $1,285 | $624,240 | $509,796 | $114,444 |
| 2017 | $70 | $107,536 | $40,294 | $67,242 |
| 2016 | $1,221 | $105,428 | $39,504 | $65,924 |
| 2015 | $1,187 | $103,845 | $38,911 | $64,934 |
| 2014 | $1,143 | $101,812 | $38,149 | $63,663 |
Source: Public Records
Map
Nearby Homes
- 1806 Stewart St
- 1002 Morse St
- 920 Morse St
- 1909-11 S Freeman St
- 1573 Vista Del Mar Way Unit 4
- 1504 Valencia St
- 1470 Burroughs St
- 1413 La Salina St
- 1834 S Tremont St
- 1840 S Tremont St
- 1738 Kurtz St
- 1451 Machado St
- 1513 California St
- 120 Sherri Ln
- 1519 Kurtz St
- 1607 Hunsaker St
- 1921 S Myers St
- 1842-46 S Pacific St
- 1720 California St
- 2156 S Coast Hwy
- 1717 Machado St
- 1726 Serrano St
- 1725 Machado St
- 1714 Serrano St
- 1729 Machado St
- 1722 Machado St
- 1717 Serrano St
- 1723 Serrano St
- 1726 Machado St
- 1718 Machado St
- 1711 Machado St
- 1733 Machado St
- 1711 Machado St
- 1729 Serrano St
- 1730 Machado St
- 1713 Serrano St
- 1714 Machado St
- 1737 Machado St
- 1705 Machado St
- 1734 Machado St
Your Personal Tour Guide
Ask me questions while you tour the home.