
Seller's Agent in 2025
Carrie Hutchinson
Re/Max Of Albany
(229) 344-4992
5 in this area
86 Total Sales

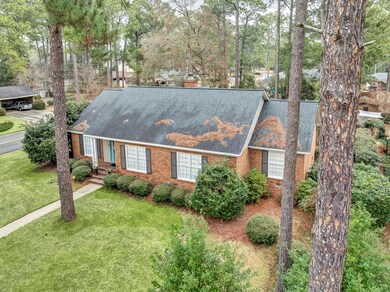
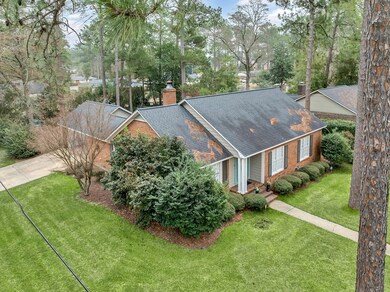
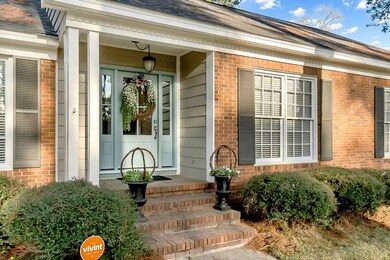

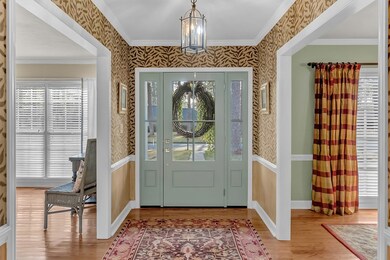
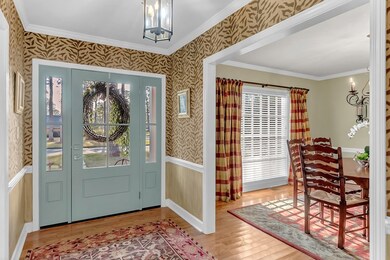
Welcome to this warm and inviting 4-bedroom, 2-bathroom home offering 2,373 sq ft of comfortable living space. As you enter, you'll be greeted by a welcoming foyer that sets the tone for the rest of this beautiful home. The foyer is flanked by the dining room and a living room that is currently being used as a music room. Both of these rooms are flooded with natural light. In the heart of the home is the family room. It is spacious and features a brick fireplace with gas logs that offer instant heat and ambiance. This eat-in kitchen has it all: stainless appliances, loads of cabinets, two pantries, and a laundry room. A large primary bedroom offers a peaceful retreat, providing plenty of space for relaxation. The other three bedrooms are nicely sized, and all bedrooms feature new carpet. Both bathrooms have been beautifully updated! Outside, enjoy a fenced backyard with an open patio, ideal for outdoor dining or entertaining, complete with a dedicated grill area. Other features include recessed lighting, corner lot, grasscloth wallpaper, plenty of closets, one of which is cedar, and a completely floored attic. This home is a true gem, combining modern updates with cozy, inviting spaces for you and your family to enjoy. Don't miss out on this beautiful home!
Last Agent to Sell the Property
Re/Max Of Albany Brokerage Phone: 2294341600 License #387608 Listed on: 12/15/2024
| Date | Type | Sale Price | Title Company |
|---|---|---|---|
| Warranty Deed | $247,000 | -- | |
| Warranty Deed | $190,000 | -- | |
| Deed | $70,000 | -- | |
| Deed | $70,000 | -- | |
| Administrators Deed | -- | -- | |
| Deed | -- | -- |
| Date | Status | Loan Amount | Loan Type |
|---|---|---|---|
| Open | $234,000 | New Conventional | |
| Previous Owner | $60,200 | New Conventional | |
| Previous Owner | $111,416 | FHA | |
| Previous Owner | $112,300 | New Conventional | |
| Previous Owner | $126,000 | New Conventional |
| Date | Event | Price | List to Sale | Price per Sq Ft |
|---|---|---|---|---|
| 05/18/2025 05/18/25 | Off Market | $255,999 | -- | -- |
| 05/12/2025 05/12/25 | Sold | $246,500 | -3.7% | $104 / Sq Ft |
| 03/17/2025 03/17/25 | Pending | -- | -- | -- |
| 02/13/2025 02/13/25 | Price Changed | $255,999 | -3.4% | $108 / Sq Ft |
| 12/15/2024 12/15/24 | For Sale | $265,000 | -- | $112 / Sq Ft |
| Year | Tax Paid | Tax Assessment Tax Assessment Total Assessment is a certain percentage of the fair market value that is determined by local assessors to be the total taxable value of land and additions on the property. | Land | Improvement |
|---|---|---|---|---|
| 2024 | $2,534 | $53,120 | $8,560 | $44,560 |
| 2023 | $2,475 | $53,120 | $8,560 | $44,560 |
| 2022 | $2,484 | $53,120 | $8,560 | $44,560 |
| 2021 | $2,303 | $53,120 | $8,560 | $44,560 |
| 2020 | $2,308 | $53,120 | $8,560 | $44,560 |
| 2019 | $2,317 | $53,120 | $8,560 | $44,560 |
| 2018 | $2,327 | $53,120 | $8,560 | $44,560 |
| 2017 | $2,168 | $53,120 | $8,560 | $44,560 |
| 2016 | $2,169 | $53,120 | $8,560 | $44,560 |
| 2015 | $2,175 | $53,120 | $8,560 | $44,560 |
| 2014 | $2,191 | $54,200 | $9,640 | $44,560 |
Seller's Agent in 2025
Carrie Hutchinson
Re/Max Of Albany
(229) 344-4992
5 in this area
86 Total Sales
Buyer's Agent in 2025
Norris Bishop
Norris Bishop Realty, LLC
(229) 589-1044
2 in this area
448 Total Sales
Source: Albany Board of REALTORS®
MLS Number: 164089
APN: 000PP-00001-001