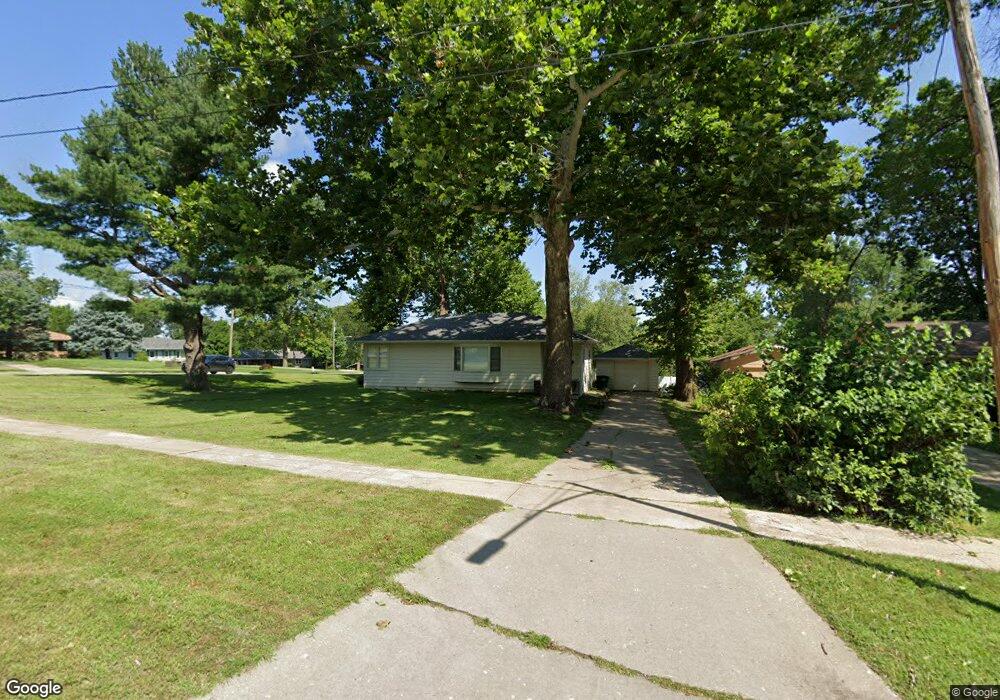
1721 Woodland Ave West Des Moines, IA 50265
Estimated Value: $230,186 - $265,000
3
Beds
1
Bath
987
Sq Ft
$248/Sq Ft
Est. Value
About This Home
This home is located at 1721 Woodland Ave, West Des Moines, IA 50265 and is currently estimated at $244,797, approximately $248 per square foot. 1721 Woodland Ave is a home located in Polk County with nearby schools including Hillside Elementary School, Stilwell Junior High School, and Valley Southwoods Freshman High School.
Ownership History
Date
Name
Owned For
Owner Type
Purchase Details
Closed on
Oct 20, 2025
Sold by
Berry Cory L
Bought by
1458 Llc
Current Estimated Value
Purchase Details
Closed on
Mar 26, 2002
Sold by
Anderson Violet L
Bought by
Berry Cory L
Home Financials for this Owner
Home Financials are based on the most recent Mortgage that was taken out on this home.
Original Mortgage
$99,920
Interest Rate
6.93%
Create a Home Valuation Report for This Property
The Home Valuation Report is an in-depth analysis detailing your home's value as well as a comparison with similar homes in the area
Home Values in the Area
Average Home Value in this Area
Purchase History
| Date | Buyer | Sale Price | Title Company |
|---|---|---|---|
| 1458 Llc | $170,000 | None Listed On Document | |
| Berry Cory L | $124,500 | -- |
Source: Public Records
Mortgage History
| Date | Status | Borrower | Loan Amount |
|---|---|---|---|
| Previous Owner | Berry Cory L | $99,920 |
Source: Public Records
Tax History Compared to Growth
Tax History
| Year | Tax Paid | Tax Assessment Tax Assessment Total Assessment is a certain percentage of the fair market value that is determined by local assessors to be the total taxable value of land and additions on the property. | Land | Improvement |
|---|---|---|---|---|
| 2025 | $2,734 | $206,400 | $70,800 | $135,600 |
| 2024 | $2,734 | $183,000 | $62,000 | $121,000 |
| 2023 | $2,722 | $183,000 | $62,000 | $121,000 |
| 2022 | $2,688 | $149,800 | $52,100 | $97,700 |
| 2021 | $2,534 | $149,800 | $52,100 | $97,700 |
| 2020 | $2,492 | $135,000 | $46,800 | $88,200 |
| 2019 | $2,472 | $135,000 | $46,800 | $88,200 |
| 2018 | $2,474 | $129,200 | $42,100 | $87,100 |
| 2017 | $2,382 | $129,200 | $42,100 | $87,100 |
| 2016 | $2,326 | $121,200 | $39,000 | $82,200 |
| 2015 | $2,326 | $121,200 | $39,000 | $82,200 |
| 2014 | $2,194 | $117,100 | $37,100 | $80,000 |
Source: Public Records
Map
Nearby Homes