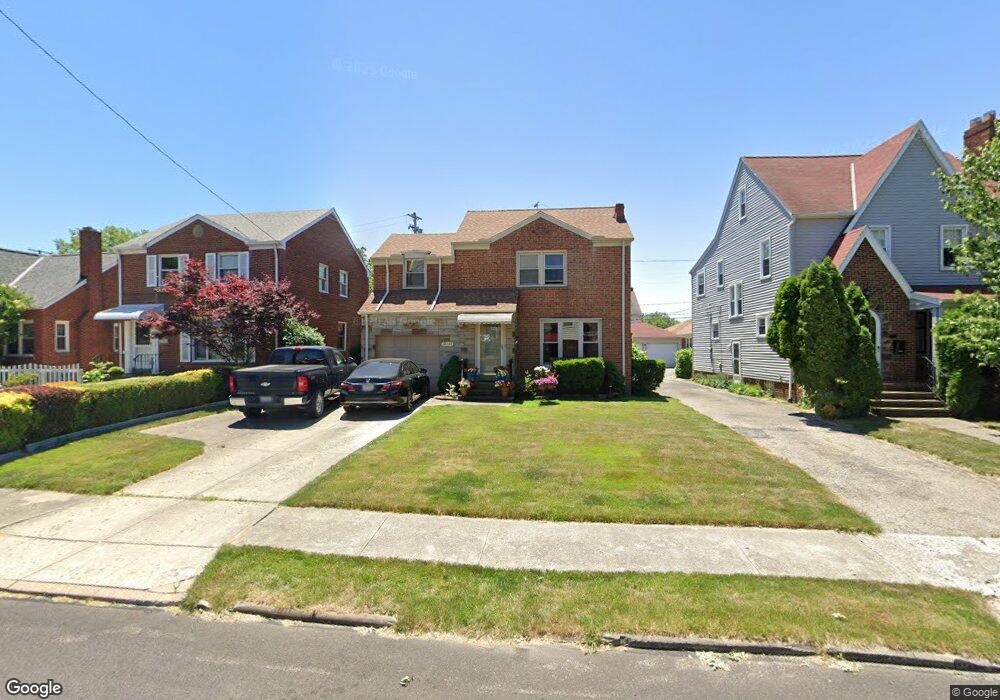
17214 Tarrymore Rd Cleveland, OH 44119
North Collinwood NeighborhoodEstimated Value: $174,265 - $236,000
3
Beds
2
Baths
1,126
Sq Ft
$182/Sq Ft
Est. Value
About This Home
This home is located at 17214 Tarrymore Rd, Cleveland, OH 44119 and is currently estimated at $205,066, approximately $182 per square foot. 17214 Tarrymore Rd is a home located in Cuyahoga County with nearby schools including Bolton, Andrew J. Rickoff School, and Anton Grdina School.
Ownership History
Date
Name
Owned For
Owner Type
Purchase Details
Closed on
Jun 9, 2010
Sold by
Iyasere Frederick T and Iyasere Patience
Bought by
Pillow William R
Current Estimated Value
Home Financials for this Owner
Home Financials are based on the most recent Mortgage that was taken out on this home.
Original Mortgage
$103,604
Outstanding Balance
$69,436
Interest Rate
4.97%
Mortgage Type
FHA
Estimated Equity
$135,630
Purchase Details
Closed on
Mar 18, 1996
Sold by
King Thomas C
Bought by
Iyasere Frederick T
Home Financials for this Owner
Home Financials are based on the most recent Mortgage that was taken out on this home.
Original Mortgage
$84,900
Interest Rate
7.06%
Mortgage Type
FHA
Purchase Details
Closed on
Aug 14, 1992
Sold by
Archie W Gillespie
Bought by
King Thomas C
Purchase Details
Closed on
Aug 15, 1979
Sold by
Gillespie Wilma
Bought by
Archie W Gillespie
Purchase Details
Closed on
Jan 1, 1975
Bought by
Gillespie Wilma
Create a Home Valuation Report for This Property
The Home Valuation Report is an in-depth analysis detailing your home's value as well as a comparison with similar homes in the area
Home Values in the Area
Average Home Value in this Area
Purchase History
| Date | Buyer | Sale Price | Title Company |
|---|---|---|---|
| Pillow William R | $105,000 | Chicago Title Insurance Co | |
| Iyasere Frederick T | $85,000 | -- | |
| King Thomas C | $69,000 | -- | |
| Archie W Gillespie | -- | -- | |
| Gillespie Wilma | -- | -- |
Source: Public Records
Mortgage History
| Date | Status | Borrower | Loan Amount |
|---|---|---|---|
| Open | Pillow William R | $103,604 | |
| Previous Owner | Iyasere Frederick T | $84,900 |
Source: Public Records
Tax History Compared to Growth
Tax History
| Year | Tax Paid | Tax Assessment Tax Assessment Total Assessment is a certain percentage of the fair market value that is determined by local assessors to be the total taxable value of land and additions on the property. | Land | Improvement |
|---|---|---|---|---|
| 2024 | $4,387 | $66,920 | $11,690 | $55,230 |
| 2023 | $3,316 | $43,720 | $8,860 | $34,860 |
| 2022 | $3,297 | $43,720 | $8,860 | $34,860 |
| 2021 | $3,264 | $43,720 | $8,860 | $34,860 |
| 2020 | $3,313 | $38,360 | $7,770 | $30,590 |
| 2019 | $3,063 | $109,600 | $22,200 | $87,400 |
| 2018 | $3,053 | $38,360 | $7,770 | $30,590 |
| 2017 | $3,190 | $38,680 | $6,970 | $31,710 |
| 2016 | $3,165 | $38,680 | $6,970 | $31,710 |
| 2015 | $2,837 | $38,680 | $6,970 | $31,710 |
| 2014 | $2,837 | $34,550 | $6,230 | $28,320 |
Source: Public Records
Map
Nearby Homes
- 17710 Crestland Rd
- 17812 E Park Dr
- 17607 Brazil Rd
- 17705 Lake Shore Blvd
- 17827 E Park Dr
- 17816 Neff Rd
- 17610 Wildwood Ln Unit 315
- 17639 Wildwood Ln Unit 17639
- 17633 Wildwood Ln Unit 311
- 18024 Marcella Rd
- 18015 Canterbury Rd
- 17930 Rosecliff Rd
- 18209 Cornwall Rd
- 18111 Marcella Rd
- 18111 Neff Rd
- 18303 Canterbury Rd
- 18402 Edgerton Rd
- 18307 Rosecliff Rd
- 983 E 179th St
- 17702 Nottingham Rd
- 17220 Tarrymore Rd
- 17208 Tarrymore Rd
- 17300 Tarrymore Rd
- 17202 Tarrymore Rd
- 17304 Tarrymore Rd
- 17117 Neff Rd
- 17203 Neff Rd
- 17109 Neff Rd
- 17308 Tarrymore Rd
- 17209 Tarrymore Rd
- 17213 Tarrymore Rd
- 17207 Neff Rd
- 17018 Dorchester Dr
- 17205 Tarrymore Rd
- 17217 Tarrymore Rd
- 17024 Dorchester Dr
- 17012 Dorchester Dr
- 17301 Tarrymore Rd
- 17201 Tarrymore Rd
- 17211 Neff Rd