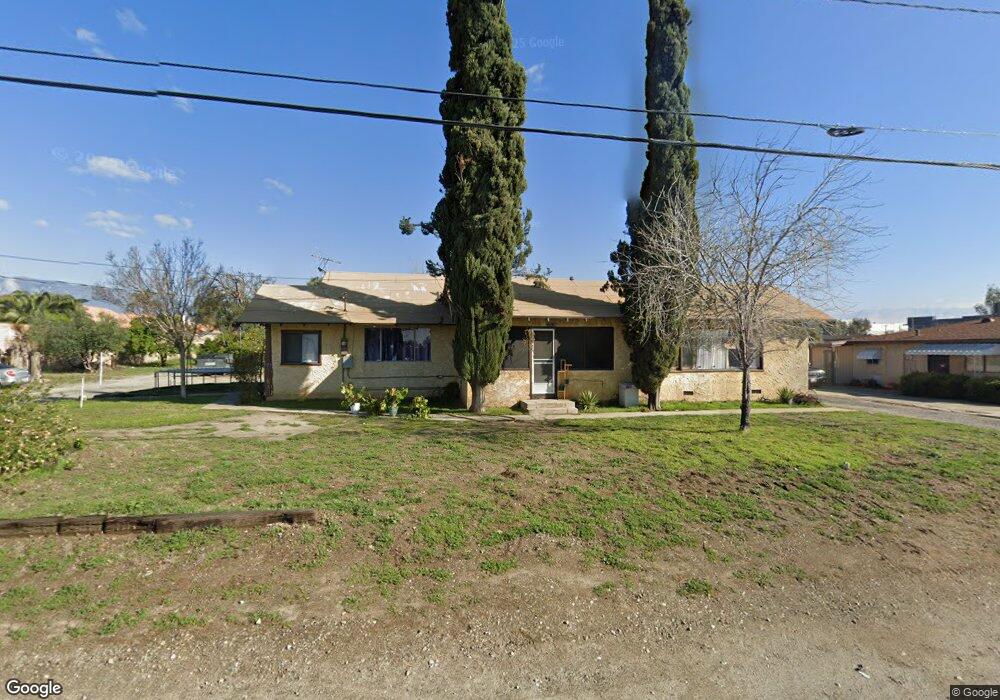
17218 Baseline Ave Fontana, CA 92336
Estimated Value: $517,000 - $924,555
3
Beds
1
Bath
1,178
Sq Ft
$558/Sq Ft
Est. Value
About This Home
This home is located at 17218 Baseline Ave, Fontana, CA 92336 and is currently estimated at $657,889, approximately $558 per square foot. 17218 Baseline Ave is a home located in San Bernardino County with nearby schools including Mango Elementary School, Wayne Ruble Middle School, and Fontana A. B. Miller High School.
Ownership History
Date
Name
Owned For
Owner Type
Purchase Details
Closed on
Feb 10, 2024
Sold by
Joe O Martinez O and Joe Esther A
Bought by
Lozano Sandra R and Martinez Joe A
Current Estimated Value
Purchase Details
Closed on
Dec 5, 2023
Sold by
Aguilar Geraldine L
Bought by
Geraldine L Aguilar 2021 Revocable Trust and Aguilar
Purchase Details
Closed on
Apr 9, 2021
Sold by
Linares Lydia
Bought by
Linares Lydia and The Lydia Linares 2021 Revocab
Purchase Details
Closed on
Apr 7, 2021
Sold by
Linares Lydia
Bought by
Lydia Linares 2021 Revocable Trust and Linares
Purchase Details
Closed on
Oct 26, 2011
Sold by
Aguilar Arthur
Bought by
Aguilar Arthur and Aguilar Margaret K
Purchase Details
Closed on
Feb 6, 2004
Sold by
Martinez Esther A
Bought by
Martinez Joe O and Martinez Esther A
Purchase Details
Closed on
Apr 10, 1998
Sold by
Aguilar Salvador V
Bought by
Martinez Esther A and Linares Lydia
Create a Home Valuation Report for This Property
The Home Valuation Report is an in-depth analysis detailing your home's value as well as a comparison with similar homes in the area
Home Values in the Area
Average Home Value in this Area
Purchase History
| Date | Buyer | Sale Price | Title Company |
|---|---|---|---|
| Lozano Sandra R | -- | None Listed On Document | |
| Geraldine L Aguilar 2021 Revocable Trust | -- | None Listed On Document | |
| Linares Lydia | -- | None Available | |
| Lydia Linares 2021 Revocable Trust | -- | None Listed On Document | |
| Aguilar Arthur | -- | None Available | |
| Martinez Joe O | -- | -- | |
| Martinez Esther A | -- | -- |
Source: Public Records
Tax History
| Year | Tax Paid | Tax Assessment Tax Assessment Total Assessment is a certain percentage of the fair market value that is determined by local assessors to be the total taxable value of land and additions on the property. | Land | Improvement |
|---|---|---|---|---|
| 2025 | $5,787 | $516,676 | $474,540 | $42,136 |
| 2024 | $3,670 | $471,728 | $431,236 | $40,492 |
| 2023 | $564 | $50,371 | $16,179 | $34,192 |
| 2022 | $562 | $49,384 | $15,862 | $33,522 |
| 2021 | $555 | $48,416 | $15,551 | $32,865 |
| 2020 | $554 | $47,920 | $15,392 | $32,528 |
| 2019 | $538 | $46,980 | $15,090 | $31,890 |
| 2018 | $546 | $46,059 | $14,794 | $31,265 |
| 2017 | $543 | $45,156 | $14,504 | $30,652 |
| 2016 | $535 | $44,271 | $14,220 | $30,051 |
| 2015 | $528 | $43,606 | $14,006 | $29,600 |
| 2014 | $529 | $42,752 | $13,732 | $29,020 |
Source: Public Records
Map
Nearby Homes
- 17190 Melon Ave
- 7127 Kempster Ave
- 7470 Ginger Dr
- 7425 Palo Verde Ave
- 17090 Micallef St
- 7590 Kempster Ct
- 7512 Sleepy Creek
- 16782 Buttonwood Ln
- 17279 Miller Ave
- 6978 Alderwood Dr
- 17079 Lurelane St
- 6949 Dew Point Way
- 17432 Fairview Rd
- 7887 Kempster Ave
- 17548 Court St
- 6650 Carmel Ct
- 17562 Court St
- 6831 Juniper Ave
- 7918 Sierra Ave
- 16929 Reed St
- 17220 Baseline Ave
- 7291 Ginger Ave
- 7281 Ginger Ave
- 17183 Pera Ct
- 17210 Mesa Ave
- 17220 Mesa Ave
- 17174 Mesa Ave
- 17230 Mesa Ave
- 7271 Ginger Ave
- 17173 Pera Ct
- 17240 Mesa Ave
- 17170 Mesa Ave
- 7261 Ginger Ave
- 17163 Pera Ct
- 17250 Mesa Ave
- 17163 Baseline Ave
- 17172 Pera Ct
- 17191 Melon Ave
- 7350 Blanchard Ave
- 17260 Mesa Ave
Your Personal Tour Guide
Ask me questions while you tour the home.