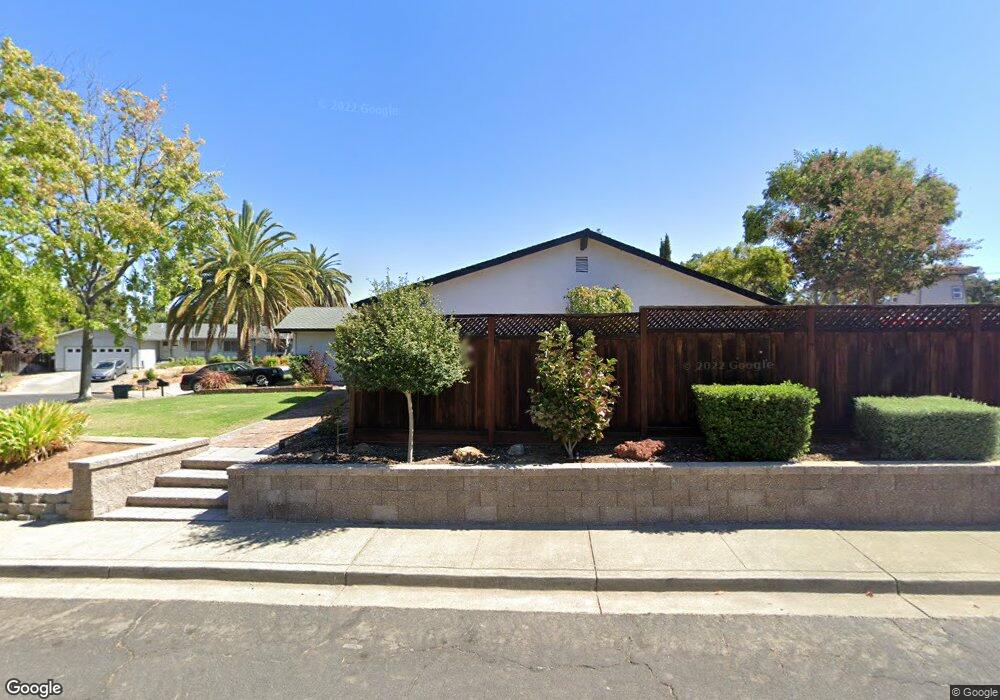
1722 Ducker Ct Concord, CA 94519
Parkside NeighborhoodEstimated Value: $705,000 - $902,000
4
Beds
2
Baths
1,762
Sq Ft
$453/Sq Ft
Est. Value
About This Home
This home is located at 1722 Ducker Ct, Concord, CA 94519 and is currently estimated at $797,879, approximately $452 per square foot. 1722 Ducker Ct is a home located in Contra Costa County with nearby schools including Wren Avenue Elementary School, El Dorado Middle School, and Concord High School.
Ownership History
Date
Name
Owned For
Owner Type
Purchase Details
Closed on
Jun 29, 2018
Sold by
Jenkins Thomas E and Jenkins Linda K
Bought by
Jenkins Thomas E and Jenkins Linda Kay
Current Estimated Value
Purchase Details
Closed on
Aug 30, 2017
Sold by
Jenkins Thomas E and Jenkins Linda Kay
Bought by
Jenkins Thomas E and Jenkins Linda Kay
Purchase Details
Closed on
Jun 8, 2001
Sold by
Jenkins Thomas E
Bought by
Jenkins Thomas E and Jenkins Linda Kay
Purchase Details
Closed on
Apr 24, 1997
Sold by
Jenkins Thomas E and Jenkins Mona M
Bought by
Jenkins Thomas E
Home Financials for this Owner
Home Financials are based on the most recent Mortgage that was taken out on this home.
Original Mortgage
$172,200
Interest Rate
7.98%
Mortgage Type
Purchase Money Mortgage
Create a Home Valuation Report for This Property
The Home Valuation Report is an in-depth analysis detailing your home's value as well as a comparison with similar homes in the area
Home Values in the Area
Average Home Value in this Area
Purchase History
| Date | Buyer | Sale Price | Title Company |
|---|---|---|---|
| Jenkins Thomas E | -- | Accommodation | |
| Jenkins Thomas E | -- | Fidelity National Title Comp | |
| Jenkins Thomas E | -- | None Available | |
| Jenkins Thomas E | -- | -- | |
| Jenkins Thomas E | -- | Commonwealth Land Title |
Source: Public Records
Mortgage History
| Date | Status | Borrower | Loan Amount |
|---|---|---|---|
| Closed | Jenkins Thomas E | $172,200 |
Source: Public Records
Tax History
| Year | Tax Paid | Tax Assessment Tax Assessment Total Assessment is a certain percentage of the fair market value that is determined by local assessors to be the total taxable value of land and additions on the property. | Land | Improvement |
|---|---|---|---|---|
| 2025 | $2,846 | $173,185 | $51,417 | $121,768 |
| 2024 | $2,682 | $169,790 | $50,409 | $119,381 |
| 2023 | $2,682 | $166,462 | $49,421 | $117,041 |
| 2022 | $2,622 | $163,199 | $48,452 | $114,747 |
| 2021 | $2,539 | $160,000 | $47,502 | $112,498 |
| 2019 | $2,474 | $155,256 | $46,094 | $109,162 |
| 2018 | $2,368 | $152,213 | $45,191 | $107,022 |
| 2017 | $2,273 | $149,229 | $44,305 | $104,924 |
| 2016 | $2,182 | $146,304 | $43,437 | $102,867 |
| 2015 | $2,126 | $144,107 | $42,785 | $101,322 |
| 2014 | $2,059 | $141,285 | $41,947 | $99,338 |
Source: Public Records
Map
Nearby Homes
- 3479 Rose Ct
- 0 Walnut Ave
- 1715 Copperleaf Ct
- 3622 Delancey Ln
- 3336 Euclid Ave
- 3641 Clayton Rd Unit 12
- 3641 Clayton Rd Unit 34
- 1579 Farm Bureau Rd
- 1901 Jacqueline Way
- 3530 Kevin Place
- 2947 Concord Blvd
- 3466 Willow Pass Rd Unit 54
- 1880 Clayton Way
- 3195 Willow Pass Rd
- 1777 Clayton Way
- 3901 Clayton Rd Unit 25
- 3959 Chestnut Ave
- 1536 Lavetta Way
- 1899 Queens Rd
- 3905 Clayton Rd Unit 37
- 1730 Ducker Ct
- 3471 Walnut Ave
- 1717 Ducker Ct
- 1738 Ducker Ct
- 3479 Walnut Ave
- 1725 Ducker Ct
- 1709 Ducker Ct
- 1741 Ducker Ct
- 3524 Bonari Ct
- 1749 Ducker Ct
- 1739 Ducker Ct
- 3451 Walnut Ave
- 3485 Walnut Ave
- 3525 Bonari Ct
- 3530 Bonari Ct
- 1731 Ducker Ct
- 3449 Walnut Ave
- 1789 Dakota Ln
- 3437 Walnut Ave
- 3501 Walnut Ave
Your Personal Tour Guide
Ask me questions while you tour the home.