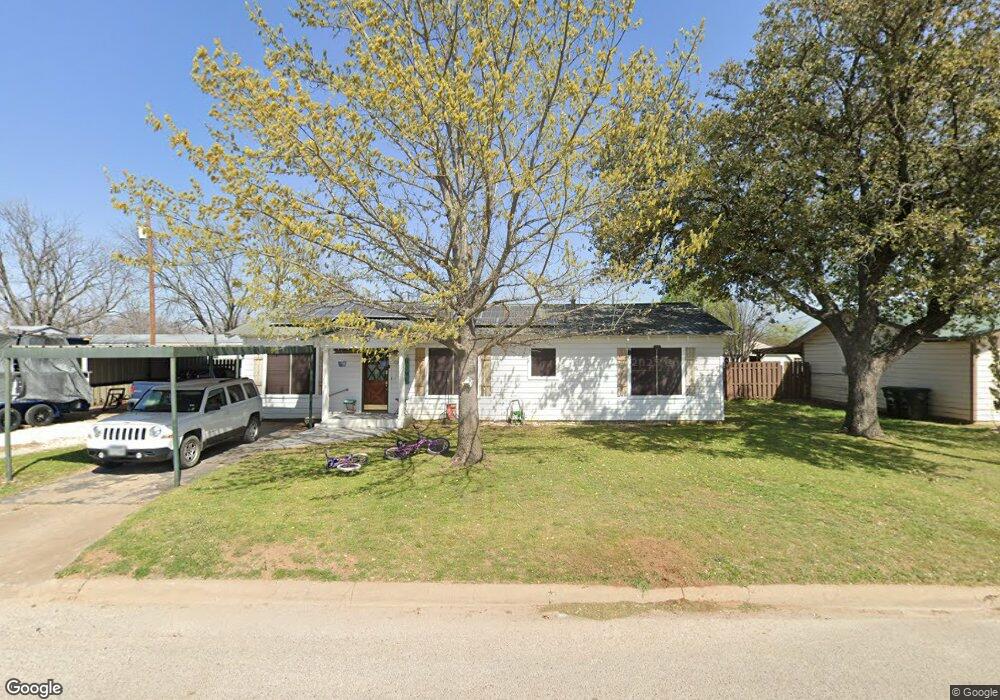
1722 Raylene Dr Cleburne, TX 76033
Estimated Value: $208,000 - $385,000
3
Beds
1
Bath
1,400
Sq Ft
$192/Sq Ft
Est. Value
About This Home
This home is located at 1722 Raylene Dr, Cleburne, TX 76033 and is currently estimated at $268,437, approximately $191 per square foot. 1722 Raylene Dr is a home located in Johnson County with nearby schools including Marti Elementary School, A.D. Wheat Middle School, and Cleburne High School.
Ownership History
Date
Name
Owned For
Owner Type
Purchase Details
Closed on
Nov 2, 2021
Sold by
Moore Charles Ray and Moore Gail
Bought by
Drew Shannon O
Current Estimated Value
Home Financials for this Owner
Home Financials are based on the most recent Mortgage that was taken out on this home.
Original Mortgage
$8,837
Outstanding Balance
$8,098
Interest Rate
2.99%
Mortgage Type
Stand Alone Second
Estimated Equity
$260,339
Create a Home Valuation Report for This Property
The Home Valuation Report is an in-depth analysis detailing your home's value as well as a comparison with similar homes in the area
Home Values in the Area
Average Home Value in this Area
Purchase History
| Date | Buyer | Sale Price | Title Company |
|---|---|---|---|
| Drew Shannon O | -- | None Available |
Source: Public Records
Mortgage History
| Date | Status | Borrower | Loan Amount |
|---|---|---|---|
| Open | Drew Shannon O | $8,837 |
Source: Public Records
Tax History
| Year | Tax Paid | Tax Assessment Tax Assessment Total Assessment is a certain percentage of the fair market value that is determined by local assessors to be the total taxable value of land and additions on the property. | Land | Improvement |
|---|---|---|---|---|
| 2025 | $2,379 | $205,108 | $25,000 | $180,108 |
| 2024 | $4,573 | $205,108 | $25,000 | $180,108 |
| 2023 | $4,190 | $188,278 | $25,000 | $163,278 |
| 2022 | $3,107 | $124,155 | $25,000 | $99,155 |
| 2021 | $2,208 | $124,155 | $25,000 | $99,155 |
| 2020 | $2,132 | $86,102 | $20,000 | $66,102 |
| 2019 | $2,066 | $69,934 | $13,000 | $56,934 |
| 2018 | $2,067 | $69,934 | $13,000 | $56,934 |
| 2017 | $2,059 | $69,934 | $13,000 | $56,934 |
| 2016 | $2,059 | $69,934 | $13,000 | $56,934 |
Source: Public Records
Map
Nearby Homes
- 1720 Raylene Dr
- 1721 Raylene Dr
- 1716 Raylene Dr
- 1719 Raylene Dr
- 1714 Raylene Dr
- 1717 Raylene Dr
- 1712 Raylene Dr
- 1713 Raylene Dr
- 1710 Raylene Dr
- 1711 Raylene Dr
- 1708 Raylene Dr
- 1709 Raylene Dr
- 1717 Redwood Dr Unit 1719
- 1717 Redwood Dr
- 1713 Redwood Dr
- 1715 Redwood Dr
- 204 W Kilpatrick St
- 1711 Redwood Dr
- 1707 Raylene Dr
- 1709 Redwood Dr
Your Personal Tour Guide
Ask me questions while you tour the home.