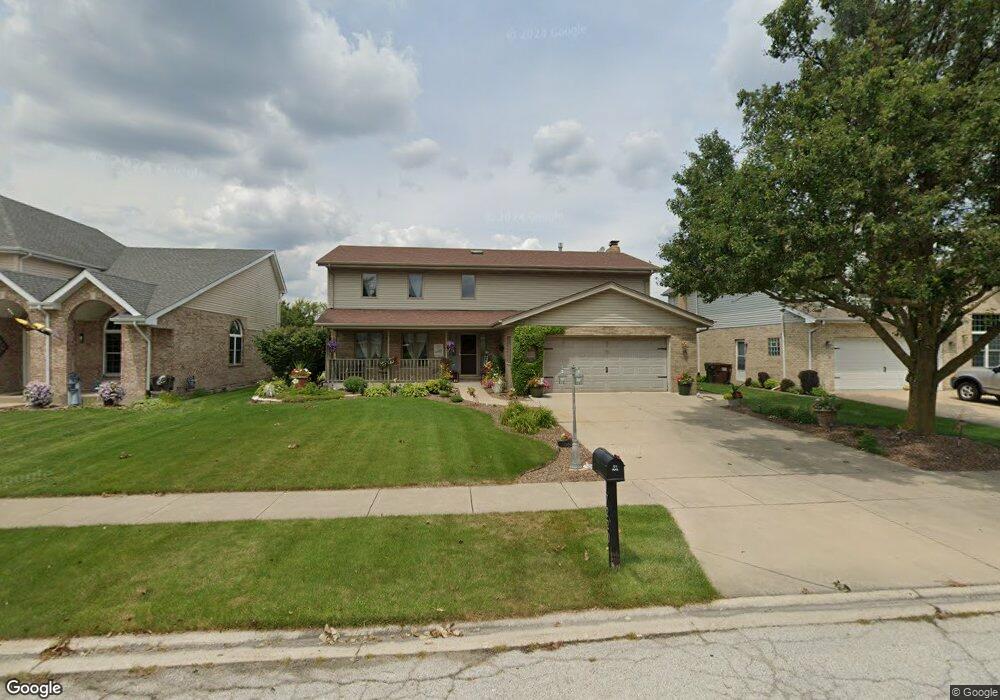
17220 Arrowhead Trace Oak Forest, IL 60452
Estimated Value: $404,887 - $487,000
4
Beds
2
Baths
2,424
Sq Ft
$181/Sq Ft
Est. Value
About This Home
This home is located at 17220 Arrowhead Trace, Oak Forest, IL 60452 and is currently estimated at $439,472, approximately $181 per square foot. 17220 Arrowhead Trace is a home located in Cook County with nearby schools including Kimberly Heights Elementary School, Scarlet Oak Elementary School, and Arbor Park Middle School.
Ownership History
Date
Name
Owned For
Owner Type
Purchase Details
Closed on
Feb 17, 2025
Sold by
Manasek Joseph and Manasek Jacquelyn H
Bought by
Joseph A Manasek Jr And Jacquelyn Manasek Fam and Manasek
Current Estimated Value
Purchase Details
Closed on
Apr 18, 2000
Sold by
Fera Peter
Bought by
Malecky James A
Purchase Details
Closed on
May 6, 1996
Sold by
E & K Builders Inc
Bought by
Manasek Joseph and Manasek Jacquelyn H
Home Financials for this Owner
Home Financials are based on the most recent Mortgage that was taken out on this home.
Original Mortgage
$182,400
Interest Rate
8.1%
Create a Home Valuation Report for This Property
The Home Valuation Report is an in-depth analysis detailing your home's value as well as a comparison with similar homes in the area
Home Values in the Area
Average Home Value in this Area
Purchase History
We collect this data history from publicly available records. To have your information removed, we recommend requesting removal directly through your county’s website.
| Date | Buyer | Sale Price | Title Company |
|---|---|---|---|
| Joseph A Manasek Jr And Jacquelyn Manasek Fam | -- | None Listed On Document | |
| Malecky James A | $30,000 | Intercounty Title | |
| Manasek Joseph | $228,000 | -- |
Source: Public Records
Mortgage History
We collect this data history from publicly available records. To have your information removed, we recommend requesting removal directly through your county’s website.
| Date | Status | Borrower | Loan Amount |
|---|---|---|---|
| Previous Owner | Manasek Joseph | $182,400 |
Source: Public Records
Tax History
| Year | Tax Paid | Tax Assessment Tax Assessment Total Assessment is a certain percentage of the fair market value that is determined by local assessors to be the total taxable value of land and additions on the property. | Land | Improvement |
|---|---|---|---|---|
| 2025 | $11,101 | $34,011 | $4,875 | $29,136 |
| 2024 | $11,101 | $34,011 | $4,875 | $29,136 |
| 2023 | $9,867 | $34,011 | $4,875 | $29,136 |
| 2022 | $9,867 | $24,603 | $4,313 | $20,290 |
| 2021 | $9,664 | $24,601 | $4,312 | $20,289 |
| 2020 | $10,104 | $26,169 | $4,312 | $21,857 |
| 2019 | $8,929 | $23,329 | $3,937 | $19,392 |
| 2018 | $8,730 | $23,329 | $3,937 | $19,392 |
| 2017 | $9,129 | $24,274 | $3,937 | $20,337 |
| 2016 | $8,494 | $21,216 | $3,375 | $17,841 |
| 2015 | $8,196 | $21,216 | $3,375 | $17,841 |
| 2014 | $8,017 | $21,216 | $3,375 | $17,841 |
| 2013 | $8,224 | $24,100 | $3,375 | $20,725 |
Source: Public Records
Map
Nearby Homes
- 5125 171st St
- 5245 170th St
- 5185 Coulter Rd
- 16909 W Thackeray Lot #8 St
- 4846 171st St
- 16861 Thackery Ave
- 16938 Cicero Ave
- 17900 Poplar Ln
- 4717 176th St
- 4656 176th Place
- 4624 177th St
- 17720 Rosewood Terrace
- 17537 Mulberry St
- 17750 Anthony Ave
- 4424 175th Place
- 5960 Lake Bluff Dr Unit 302
- 6050 Lake Bluff Dr Unit 201
- 6010 Lake Bluff Dr Unit 301
- 6020 Lake Bluff Dr Unit 60205
- 4428 Lisa Ln
- 17220 Arrowhead Trace
- 17208 Arrowhead Trace
- 17226 Arrowhead Trace
- 17202 Arrowhead Trace
- 17232 Arrowhead Trace
- 17207 Arrowhead Trace
- 17219 Arrowhead Trace
- 17201 Arrowhead Trace
- 17225 Arrowhead Trace
- 17238 Arrowhead Trace
- 17231 Arrowhead Trace
- 5123 Arrowhead Trace
- 17237 Arrowhead Trace
- 17244 Arrowhead Trace
- 5122 Chippewa Ct
- 5116 Chippewa Ct
- 17255 Arrowhead Trace
- 5110 Chippewa Ct
- 17250 Arrowhead Trace
- 5124 Chippewa Ct
Your Personal Tour Guide
Ask me questions while you tour the home.