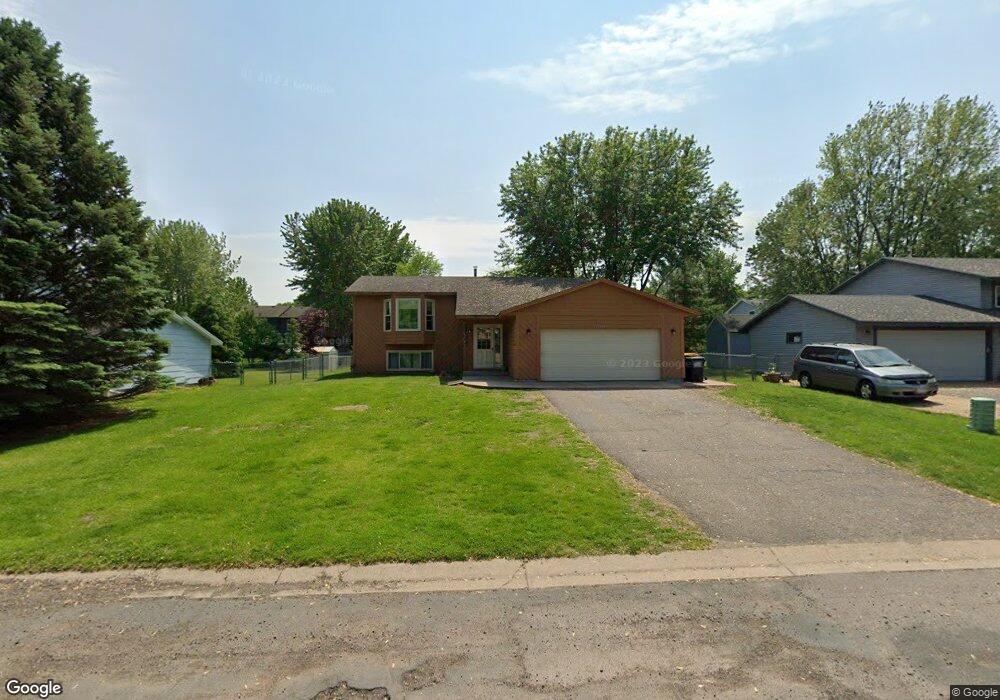
17225 Finch Path Farmington, MN 55024
Estimated Value: $372,000 - $382,061
4
Beds
2
Baths
1,676
Sq Ft
$225/Sq Ft
Est. Value
About This Home
This home is located at 17225 Finch Path, Farmington, MN 55024 and is currently estimated at $377,015, approximately $224 per square foot. 17225 Finch Path is a home located in Dakota County with nearby schools including North Trail Elementary School, Levi P. Dodge Middle School, and Farmington High School.
Ownership History
Date
Name
Owned For
Owner Type
Purchase Details
Closed on
Jun 3, 2021
Sold by
Fulsaas Randy A and Fulsaas Heidi M
Bought by
Holum Paige Marie
Current Estimated Value
Home Financials for this Owner
Home Financials are based on the most recent Mortgage that was taken out on this home.
Original Mortgage
$276,000
Outstanding Balance
$249,884
Interest Rate
2.9%
Mortgage Type
New Conventional
Estimated Equity
$127,131
Purchase Details
Closed on
Jul 20, 2017
Sold by
Jabs John D and Jabs Patricia
Bought by
Fulsaas Randy A and Fulsaas Heidi M
Home Financials for this Owner
Home Financials are based on the most recent Mortgage that was taken out on this home.
Original Mortgage
$228,779
Interest Rate
3.88%
Mortgage Type
Unknown
Create a Home Valuation Report for This Property
The Home Valuation Report is an in-depth analysis detailing your home's value as well as a comparison with similar homes in the area
Home Values in the Area
Average Home Value in this Area
Purchase History
| Date | Buyer | Sale Price | Title Company |
|---|---|---|---|
| Holum Paige Marie | $345,000 | Executive Ttl Northwest Llc | |
| Fulsaas Randy A | $234,266 | Watermark Title Agency Llc | |
| Holum Paige Paige | $345,000 | -- |
Source: Public Records
Mortgage History
| Date | Status | Borrower | Loan Amount |
|---|---|---|---|
| Open | Holum Paige Marie | $276,000 | |
| Previous Owner | Fulsaas Randy A | $228,779 | |
| Previous Owner | Fulsaas Randy A | $228,779 | |
| Closed | Holum Paige Paige | $276,000 |
Source: Public Records
Tax History Compared to Growth
Tax History
| Year | Tax Paid | Tax Assessment Tax Assessment Total Assessment is a certain percentage of the fair market value that is determined by local assessors to be the total taxable value of land and additions on the property. | Land | Improvement |
|---|---|---|---|---|
| 2024 | $3,936 | $313,400 | $69,200 | $244,200 |
| 2023 | $3,936 | $320,900 | $69,000 | $251,900 |
| 2022 | $3,120 | $305,400 | $68,800 | $236,600 |
| 2021 | $2,938 | $259,700 | $59,800 | $199,900 |
| 2020 | $3,012 | $239,400 | $56,900 | $182,500 |
| 2019 | $2,944 | $237,200 | $58,200 | $179,000 |
| 2018 | $2,715 | $231,200 | $55,400 | $175,800 |
| 2017 | $2,664 | $211,600 | $52,800 | $158,800 |
| 2016 | $2,663 | $202,600 | $50,300 | $152,300 |
| 2015 | $2,350 | $176,291 | $43,915 | $132,376 |
| 2014 | -- | $167,789 | $42,371 | $125,418 |
| 2013 | -- | $152,093 | $38,089 | $114,004 |
Source: Public Records
Map
Nearby Homes
- 17126 Firtree Place
- 17415 Fireside Ln
- 6882 173rd St W
- 17583 Foxboro Ln
- 17698 Fortune Trail
- 6649 167th St W
- 17867 Flint Ave
- 6678 166th St W
- 16563 Fishing Ave W
- 5987 178th St W
- 17408 Gettysburg Way Unit 24184
- 16546 Foliage Ave W
- 17818 Evershed Way
- 17373 N Creek Dr
- 5969 Upper 179th St W
- 17830 Glasgow Way
- 6656 Gerdine Path W
- 7130 167th Ct W
- 5956 Upper 179th St W
- 16660 Garland Way W
- 17231 Finch Path
- 17219 Finch Path
- 17224 17224 Finch Path
- 6439 173rd St W
- 17213 Finch Path
- 6413 6413 173rd St W
- 17237 Finch Path
- 17237 17237 Finch Path
- 17224 Finch Path
- 6451 173rd St W
- 17218 Finch Path
- 6401 173rd St W
- 17207 Finch Path
- 17236 Finch Path
- 17236 17236 Finch Path
- 17270 17270 Fireside Ln
- 17212 Finch Path
- 6463 6463 173rd St W
- 6463 173rd St W
- 17242 Finch Path