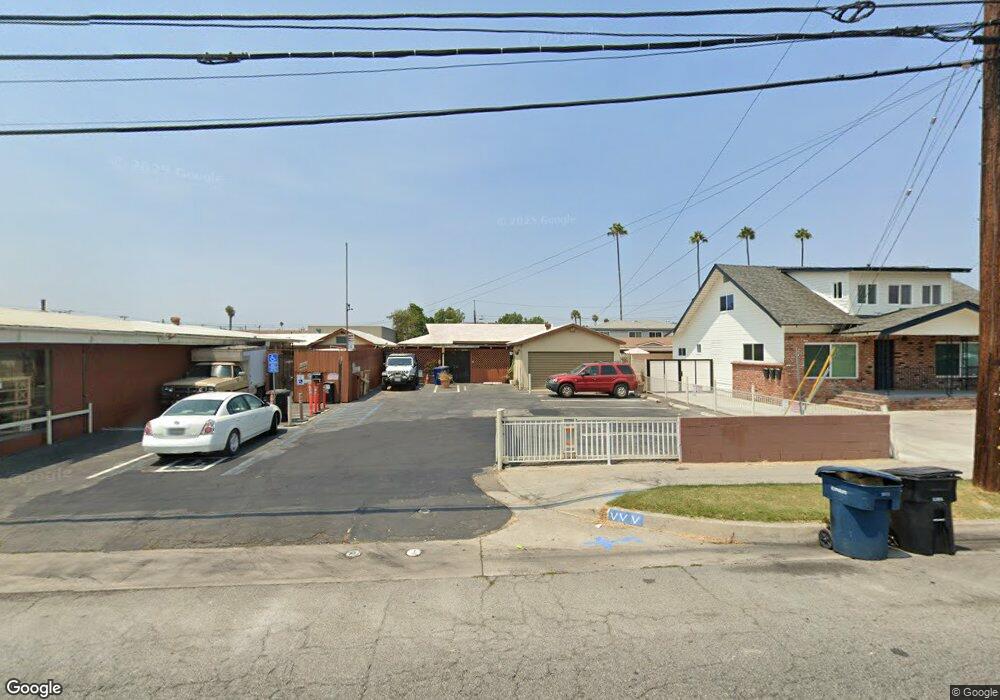
17227 Clark Ave Bellflower, CA 90706
Estimated Value: $687,000 - $818,022
2
Beds
1
Bath
1,030
Sq Ft
$736/Sq Ft
Est. Value
About This Home
This home is located at 17227 Clark Ave, Bellflower, CA 90706 and is currently estimated at $758,506, approximately $736 per square foot. 17227 Clark Ave is a home located in Los Angeles County with nearby schools including Mayfair High School and St. Bernard School.
Ownership History
Date
Name
Owned For
Owner Type
Purchase Details
Closed on
May 2, 1997
Sold by
Boggs Virginia Clanton
Bought by
Hails Samuel C and The Samuel C Hails Family Trust
Current Estimated Value
Home Financials for this Owner
Home Financials are based on the most recent Mortgage that was taken out on this home.
Original Mortgage
$60,000
Outstanding Balance
$8,317
Interest Rate
8.14%
Estimated Equity
$750,189
Purchase Details
Closed on
Nov 15, 1996
Sold by
Avila Charles T
Bought by
Boggs Virginia Clanton and Virginia Clanton Boggs Trust
Purchase Details
Closed on
Mar 21, 1994
Sold by
Bylsma Albert
Bought by
Avila Charles T and Avila Ferne L
Home Financials for this Owner
Home Financials are based on the most recent Mortgage that was taken out on this home.
Original Mortgage
$123,500
Interest Rate
7.67%
Mortgage Type
Seller Take Back
Create a Home Valuation Report for This Property
The Home Valuation Report is an in-depth analysis detailing your home's value as well as a comparison with similar homes in the area
Home Values in the Area
Average Home Value in this Area
Purchase History
| Date | Buyer | Sale Price | Title Company |
|---|---|---|---|
| Hails Samuel C | $153,000 | -- | |
| Boggs Virginia Clanton | -- | -- | |
| Avila Charles T | $148,500 | Chicago Title Insurance Co |
Source: Public Records
Mortgage History
| Date | Status | Borrower | Loan Amount |
|---|---|---|---|
| Open | Hails Samuel C | $60,000 | |
| Previous Owner | Avila Charles T | $123,500 |
Source: Public Records
Tax History Compared to Growth
Tax History
| Year | Tax Paid | Tax Assessment Tax Assessment Total Assessment is a certain percentage of the fair market value that is determined by local assessors to be the total taxable value of land and additions on the property. | Land | Improvement |
|---|---|---|---|---|
| 2025 | $3,337 | $249,157 | $195,429 | $53,728 |
| 2024 | $3,337 | $244,273 | $191,598 | $52,675 |
| 2023 | $3,213 | $239,485 | $187,842 | $51,643 |
| 2022 | $3,155 | $234,790 | $184,159 | $50,631 |
| 2021 | $3,092 | $230,188 | $180,549 | $49,639 |
| 2019 | $3,014 | $223,363 | $175,195 | $48,168 |
| 2018 | $2,822 | $218,984 | $171,760 | $47,224 |
| 2016 | $2,704 | $210,484 | $165,092 | $45,392 |
| 2015 | $2,649 | $207,324 | $162,613 | $44,711 |
| 2014 | $2,618 | $203,264 | $159,428 | $43,836 |
Source: Public Records
Map
Nearby Homes
- 9235 Artesia Blvd Unit 5
- 17046 Clark Ave
- 17458 Deerfield Ave
- 9133 Ramona St Unit 2
- 9224 Walnut St
- 9513 Cedar St
- 9253 Rose St
- 9112 Cedar St
- 16821 Ardmore Ave
- 9713 Cedar St
- 9231 Laurel St
- 17820 Lakewood Blvd Unit 30
- 17820 Lakewood Blvd Unit 3
- 5134 Ashworth St
- 9833 Palm St
- 8819 Park St Unit 29
- 9833 Walnut St
- 8723 Artesia Blvd Unit 68
- 6107 Faculty Ave
- 9719 Belmont St
- 17217 Clark Ave
- 17207 Clark Ave
- 9412 Beverly St
- 9328 Palm St
- 9337 Artesia Blvd
- 9324 Palm St Unit C
- 9324 Palm St Unit B
- 9324 Palm St Unit A
- 9403 Artesia Blvd
- 9326 Palm St Unit D
- 9326 Palm St Unit C
- 9326 Palm St Unit B
- 9326 Palm St Unit A
- 9322 Palm St Unit F
- 9322 Palm St Unit E
- 9322 Palm St Unit D
- 9322 Palm St Unit C
- 9322 Palm St Unit B
- 9322 Palm St Unit A
- 9320 Palm St