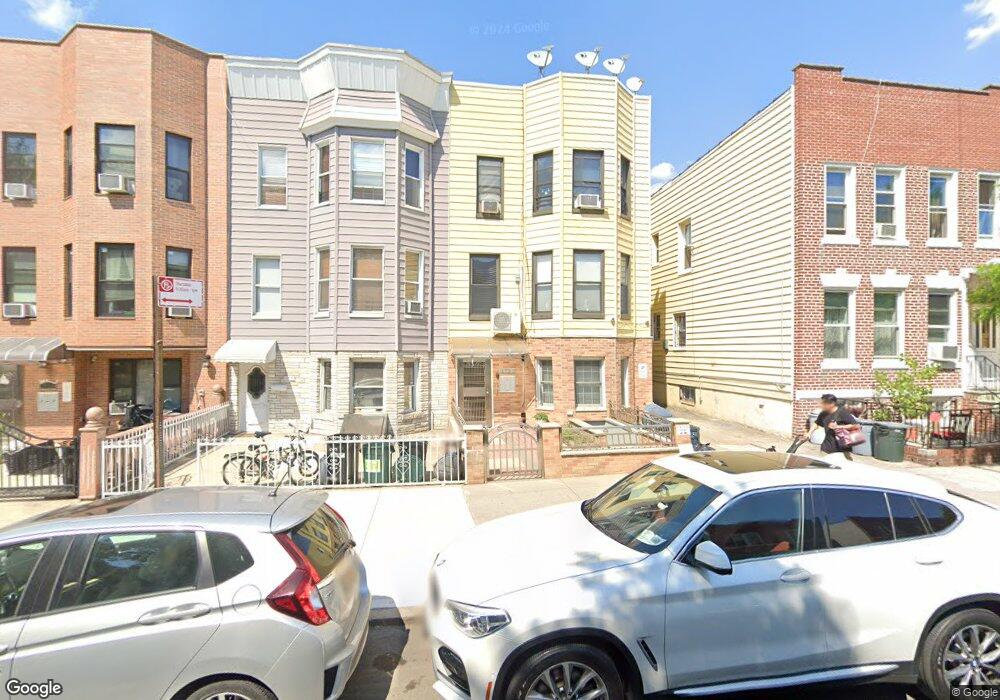
1723 78th St Brooklyn, NY 11214
Bensonhurst NeighborhoodEstimated Value: $955,606 - $1,460,000
Studio
--
Bath
2,472
Sq Ft
$536/Sq Ft
Est. Value
About This Home
This home is located at 1723 78th St, Brooklyn, NY 11214 and is currently estimated at $1,323,902, approximately $535 per square foot. 1723 78th St is a home located in Kings County with nearby schools including P.S. 186 Dr. Irving A. Gladstone Elementary School, Junior High School 227 Edward B Shallow, and New Utrecht High School.
Ownership History
Date
Name
Owned For
Owner Type
Purchase Details
Closed on
Aug 15, 2019
Sold by
Xu Zai Lan and Zhong Xue Zhen
Bought by
Lei Jimmy Z and Zhong Xue Zhen
Current Estimated Value
Purchase Details
Closed on
Feb 25, 2004
Sold by
Chandan Renu B
Bought by
Xu Zai Lan and Zhong Xue Zhen
Home Financials for this Owner
Home Financials are based on the most recent Mortgage that was taken out on this home.
Original Mortgage
$305,000
Interest Rate
5.56%
Mortgage Type
Purchase Money Mortgage
Purchase Details
Closed on
Oct 21, 1997
Sold by
Murtagh Ann Mattia
Bought by
Chandan Sanjiv and Chandan Renu B
Home Financials for this Owner
Home Financials are based on the most recent Mortgage that was taken out on this home.
Original Mortgage
$195,200
Interest Rate
8.37%
Create a Home Valuation Report for This Property
The Home Valuation Report is an in-depth analysis detailing your home's value as well as a comparison with similar homes in the area
Home Values in the Area
Average Home Value in this Area
Purchase History
| Date | Buyer | Sale Price | Title Company |
|---|---|---|---|
| Lei Jimmy Z | -- | -- | |
| Xu Zai Lan | $456,000 | -- | |
| Chandan Sanjiv | $244,000 | Commonwealth Land Title Ins |
Source: Public Records
Mortgage History
| Date | Status | Borrower | Loan Amount |
|---|---|---|---|
| Previous Owner | Xu Zai Lan | $305,000 | |
| Previous Owner | Chandan Sanjiv | $195,200 |
Source: Public Records
Tax History
| Year | Tax Paid | Tax Assessment Tax Assessment Total Assessment is a certain percentage of the fair market value that is determined by local assessors to be the total taxable value of land and additions on the property. | Land | Improvement |
|---|---|---|---|---|
| 2025 | $8,894 | $88,440 | $14,760 | $73,680 |
| 2024 | $8,894 | $77,460 | $14,760 | $62,700 |
| 2023 | $8,557 | $94,920 | $14,760 | $80,160 |
| 2022 | $7,982 | $80,520 | $14,760 | $65,760 |
| 2021 | $7,963 | $85,560 | $14,760 | $70,800 |
| 2020 | $3,957 | $70,200 | $14,760 | $55,440 |
| 2019 | $7,720 | $70,200 | $14,760 | $55,440 |
| 2018 | $7,158 | $35,112 | $7,968 | $27,144 |
| 2017 | $6,792 | $33,321 | $7,943 | $25,378 |
| 2016 | $6,303 | $31,530 | $8,618 | $22,912 |
| 2015 | $3,791 | $31,524 | $10,825 | $20,699 |
| 2014 | $3,791 | $30,753 | $10,889 | $19,864 |
Source: Public Records
Map
Nearby Homes
Your Personal Tour Guide
Ask me questions while you tour the home.