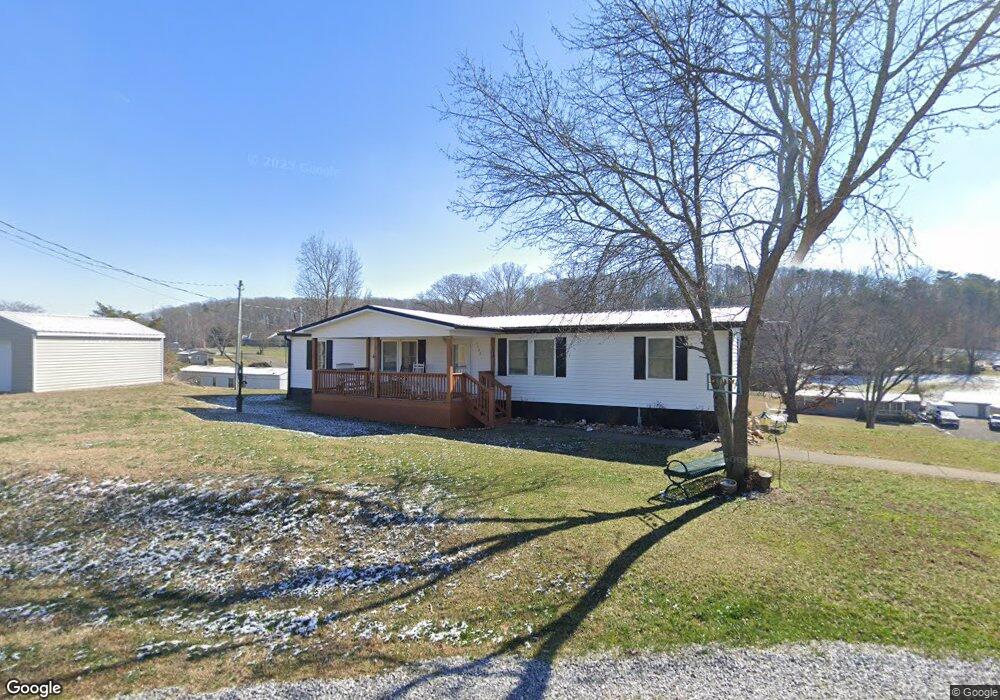
1723 Circle Lake Dr Dandridge, TN 37725
Estimated Value: $234,424 - $308,000
--
Bed
2
Baths
1,440
Sq Ft
$185/Sq Ft
Est. Value
About This Home
This home is located at 1723 Circle Lake Dr, Dandridge, TN 37725 and is currently estimated at $266,606, approximately $185 per square foot. 1723 Circle Lake Dr is a home located in Jefferson County.
Ownership History
Date
Name
Owned For
Owner Type
Purchase Details
Closed on
Jun 16, 2015
Sold by
Engle John W
Bought by
Lovelace Phyllis Brummitte
Current Estimated Value
Purchase Details
Closed on
Jan 6, 2006
Sold by
Gene Perryman
Bought by
Engle John W
Purchase Details
Closed on
Oct 20, 2005
Bought by
Engle John W and Engle Mary L
Purchase Details
Closed on
Nov 13, 2003
Sold by
Carroll Cannon D and Carroll Tammy K
Bought by
Gene Perryman
Purchase Details
Closed on
Oct 31, 2003
Bought by
Perryman Gene
Purchase Details
Closed on
May 23, 1997
Sold by
Edward Burress and Edward Cathleen
Bought by
Cannon Carroll
Home Financials for this Owner
Home Financials are based on the most recent Mortgage that was taken out on this home.
Original Mortgage
$9,900
Interest Rate
8.13%
Purchase Details
Closed on
Jun 21, 1988
Bought by
Burress Edward and Burress Cathleen
Purchase Details
Closed on
Jun 10, 1949
Bought by
Craddock Craddock C and Craddock Faye
Create a Home Valuation Report for This Property
The Home Valuation Report is an in-depth analysis detailing your home's value as well as a comparison with similar homes in the area
Home Values in the Area
Average Home Value in this Area
Purchase History
| Date | Buyer | Sale Price | Title Company |
|---|---|---|---|
| Lovelace Phyllis Brummitte | $95,000 | -- | |
| Engle John W | $61,500 | -- | |
| Engle John W | $61,500 | -- | |
| Gene Perryman | $3,812 | -- | |
| Perryman Gene | $3,800 | -- | |
| Cannon Carroll | $14,900 | -- | |
| Burress Edward | $15,400 | -- | |
| Craddock Craddock C | -- | -- |
Source: Public Records
Mortgage History
| Date | Status | Borrower | Loan Amount |
|---|---|---|---|
| Previous Owner | Craddock Craddock C | $9,900 |
Source: Public Records
Tax History Compared to Growth
Tax History
| Year | Tax Paid | Tax Assessment Tax Assessment Total Assessment is a certain percentage of the fair market value that is determined by local assessors to be the total taxable value of land and additions on the property. | Land | Improvement |
|---|---|---|---|---|
| 2025 | $555 | $45,525 | $13,500 | $32,025 |
| 2023 | $555 | $24,150 | $0 | $0 |
| 2022 | $529 | $24,150 | $6,900 | $17,250 |
| 2021 | $529 | $24,150 | $6,900 | $17,250 |
| 2020 | $529 | $24,150 | $6,900 | $17,250 |
| 2019 | $529 | $24,150 | $6,900 | $17,250 |
| 2018 | $419 | $17,850 | $6,300 | $11,550 |
| 2017 | $419 | $17,850 | $6,300 | $11,550 |
| 2016 | $419 | $17,850 | $6,300 | $11,550 |
| 2015 | $419 | $17,850 | $6,300 | $11,550 |
| 2014 | -- | $17,850 | $6,300 | $11,550 |
Source: Public Records
Map
Nearby Homes
- 1734 Old Oak Grove Rd
- 1724 Circle Lake Dr
- 1729 Old Oak Grove Rd
- 1729 Old Oak Grove Rd
- 1729 Old Oak Grove Rd
- 1729 Old Oak Grove Rd
- 1733 Circle Lake Dr
- 1895 Circle Lake Dr
- 1748 Old Oak Grove Rd
- 1737 Circle Lake Dr
- 1749 Old Oak Grove Rd
- 1748 Circle Lake Dr
- 1752 Old Oak Grove Rd
- 0 Circle Lake Dr
- 1739 Circle Lake Dr
- 1718 Oak Grove Rd
- 815 Burchfield Rd
- 1883 Circle Lake Dr
- 1758 Old Oak Grove Rd
- 1745 Circle Lake Dr