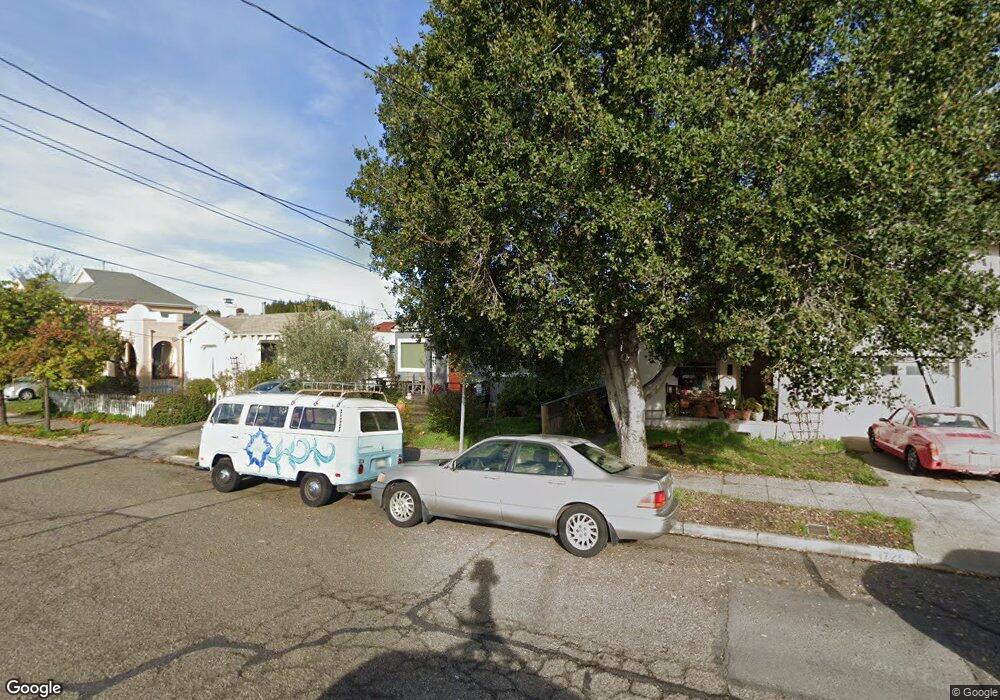
1723 Derby St Berkeley, CA 94703
South Berkeley NeighborhoodEstimated Value: $872,000 - $1,240,000
2
Beds
1
Bath
975
Sq Ft
$1,130/Sq Ft
Est. Value
About This Home
This home is located at 1723 Derby St, Berkeley, CA 94703 and is currently estimated at $1,101,581, approximately $1,129 per square foot. 1723 Derby St is a home located in Alameda County with nearby schools including Malcolm X Elementary School, Emerson Elementary School, and John Muir Elementary School.
Ownership History
Date
Name
Owned For
Owner Type
Purchase Details
Closed on
Sep 20, 2010
Sold by
Goodwin Frances R
Bought by
Uberman Eve Meyer
Current Estimated Value
Home Financials for this Owner
Home Financials are based on the most recent Mortgage that was taken out on this home.
Original Mortgage
$300,000
Outstanding Balance
$197,495
Interest Rate
4.38%
Mortgage Type
New Conventional
Estimated Equity
$904,086
Purchase Details
Closed on
Jan 3, 2005
Sold by
Miller Taplin Gertrude
Bought by
Miller Taplin Gertrude and Goodwin Frances R
Purchase Details
Closed on
Feb 17, 2001
Sold by
Taplin Olehue
Bought by
Taplin Olehue and The Olehue Taplin Living Trust
Create a Home Valuation Report for This Property
The Home Valuation Report is an in-depth analysis detailing your home's value as well as a comparison with similar homes in the area
Home Values in the Area
Average Home Value in this Area
Purchase History
| Date | Buyer | Sale Price | Title Company |
|---|---|---|---|
| Uberman Eve Meyer | $429,000 | Chicago Title Company | |
| Miller Taplin Gertrude | -- | -- | |
| Taplin Olehue | -- | -- |
Source: Public Records
Mortgage History
| Date | Status | Borrower | Loan Amount |
|---|---|---|---|
| Open | Uberman Eve Meyer | $300,000 |
Source: Public Records
Tax History
| Year | Tax Paid | Tax Assessment Tax Assessment Total Assessment is a certain percentage of the fair market value that is determined by local assessors to be the total taxable value of land and additions on the property. | Land | Improvement |
|---|---|---|---|---|
| 2025 | $9,169 | $542,591 | $164,877 | $384,714 |
| 2024 | $9,169 | $531,818 | $161,645 | $377,173 |
| 2023 | $9,404 | $528,257 | $158,477 | $369,780 |
| 2022 | $8,687 | $510,901 | $155,370 | $362,531 |
| 2021 | $8,699 | $500,747 | $152,324 | $355,423 |
| 2020 | $8,275 | $502,543 | $150,763 | $351,780 |
| 2019 | $7,982 | $492,693 | $147,808 | $344,885 |
| 2018 | $7,833 | $483,036 | $144,911 | $338,125 |
| 2017 | $7,542 | $473,568 | $142,070 | $331,498 |
| 2016 | $7,302 | $464,284 | $139,285 | $324,999 |
| 2015 | $7,196 | $457,313 | $137,194 | $320,119 |
| 2014 | $7,087 | $448,355 | $134,506 | $313,849 |
Source: Public Records
Map
Nearby Homes
- 1634 Blake St
- 1612 Parker St
- 2701 Grant St
- 1645 Dwight Way
- 1604 Dwight Way
- 1901 Parker St Unit 3
- 1515 Derby St
- 2829 California St
- 2750 Sacramento St
- 1450 Ward St
- 2758 Sacramento St
- 2774 Sacramento St
- 2782 Sacramento St
- 2790 Sacramento St
- 2018 Blake St
- 2926 Ellis St
- 1535 Julia St
- 2350 Sacramento St
- 1646 Ashby Ave
- 2922 Stanton St
Your Personal Tour Guide
Ask me questions while you tour the home.