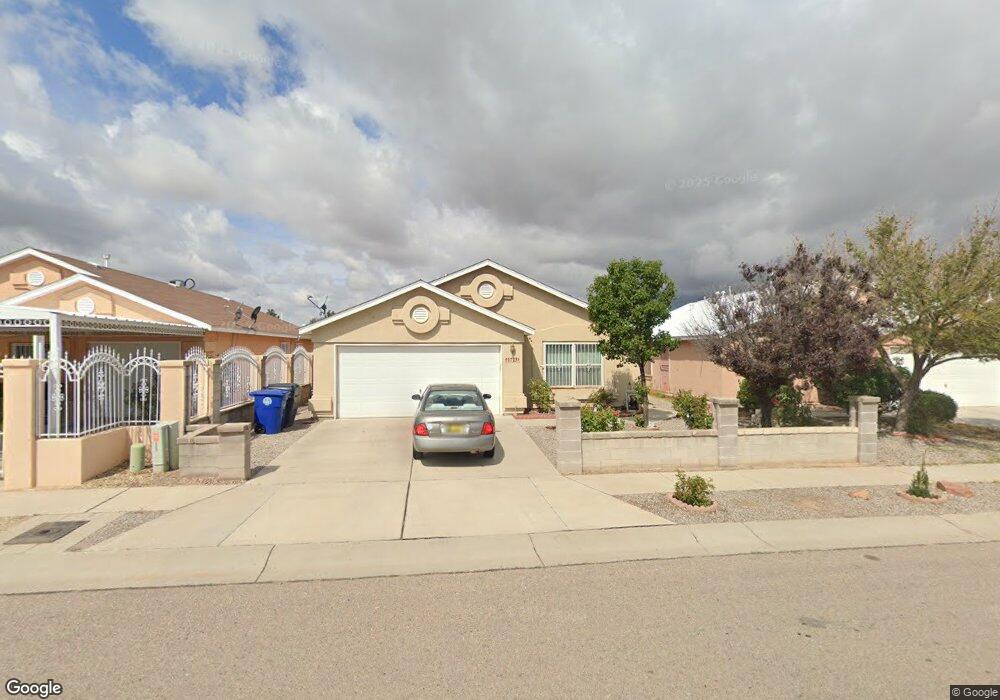
1723 Desert Ridge Rd SW Albuquerque, NM 87121
Southwest Heights NeighborhoodEstimated Value: $272,000 - $281,000
3
Beds
2
Baths
1,355
Sq Ft
$205/Sq Ft
Est. Value
About This Home
This home is located at 1723 Desert Ridge Rd SW, Albuquerque, NM 87121 and is currently estimated at $277,825, approximately $205 per square foot. 1723 Desert Ridge Rd SW is a home located in Bernalillo County with nearby schools including Maryann Binford Elementary School, Truman Middle School, and Atrisco Heritage Academy High School.
Ownership History
Date
Name
Owned For
Owner Type
Purchase Details
Closed on
Jan 19, 2007
Sold by
Romero Dores
Bought by
Lueras Diana
Current Estimated Value
Home Financials for this Owner
Home Financials are based on the most recent Mortgage that was taken out on this home.
Original Mortgage
$140,000
Outstanding Balance
$82,678
Interest Rate
6.09%
Mortgage Type
Purchase Money Mortgage
Estimated Equity
$195,147
Purchase Details
Closed on
Jan 25, 2006
Sold by
Chavez Escamilla Ivonne and Escamilla Jesus
Bought by
Romero Dores
Home Financials for this Owner
Home Financials are based on the most recent Mortgage that was taken out on this home.
Original Mortgage
$110,700
Interest Rate
6.22%
Mortgage Type
Fannie Mae Freddie Mac
Purchase Details
Closed on
Sep 28, 2001
Sold by
Artistic Homes Inc
Bought by
Chavez Ivonne C
Home Financials for this Owner
Home Financials are based on the most recent Mortgage that was taken out on this home.
Original Mortgage
$96,256
Interest Rate
6.88%
Create a Home Valuation Report for This Property
The Home Valuation Report is an in-depth analysis detailing your home's value as well as a comparison with similar homes in the area
Home Values in the Area
Average Home Value in this Area
Purchase History
| Date | Buyer | Sale Price | Title Company |
|---|---|---|---|
| Lueras Diana | -- | Fidelity National Title Co | |
| Romero Dores | -- | Fidelity National Title Co | |
| Chavez Ivonne C | -- | First American Title Co |
Source: Public Records
Mortgage History
| Date | Status | Borrower | Loan Amount |
|---|---|---|---|
| Open | Lueras Diana | $140,000 | |
| Previous Owner | Romero Dores | $110,700 | |
| Previous Owner | Chavez Ivonne C | $96,256 |
Source: Public Records
Tax History Compared to Growth
Tax History
| Year | Tax Paid | Tax Assessment Tax Assessment Total Assessment is a certain percentage of the fair market value that is determined by local assessors to be the total taxable value of land and additions on the property. | Land | Improvement |
|---|---|---|---|---|
| 2025 | $1,633 | $41,922 | $11,868 | $30,054 |
| 2024 | $1,633 | $40,702 | $11,523 | $29,179 |
| 2023 | $1,603 | $39,516 | $11,187 | $28,329 |
| 2022 | $1,547 | $38,366 | $10,862 | $27,504 |
| 2021 | $1,492 | $37,248 | $10,545 | $26,703 |
| 2020 | $1,465 | $36,164 | $10,238 | $25,926 |
| 2019 | $1,420 | $35,111 | $9,940 | $25,171 |
| 2018 | $1,367 | $35,111 | $9,940 | $25,171 |
| 2017 | $1,322 | $34,089 | $9,651 | $24,438 |
| 2016 | $1,282 | $32,132 | $9,097 | $23,035 |
| 2015 | $31,196 | $31,196 | $8,832 | $22,364 |
| 2014 | $1,252 | $31,496 | $8,832 | $22,664 |
| 2013 | -- | $31,763 | $8,832 | $22,931 |
Source: Public Records
Map
Nearby Homes
- 8600 Kimela Ct SW
- 1209 Locura Rd SW
- 8524 Stony Creek Rd SW
- 7901 Purple Fringe Rd SW
- 1327 Amole Vista St SW
- 1420 Summerfield Place SW
- 9300 Jenny Ave SW
- 9909 Saddlehorn Trail SW
- 7814 Desert Canyon Place SW
- 9508 Sage Ranch Ct SW
- 9520 Sage Ranch Ct SW
- 1815 Shadetree Dr SW
- 9600 Sage Ranch Ct
- 9504 Sage Ranch Ct
- 9616 Sage Ranch Ct SW
- 8709 Rhonda Ave SW
- 9609 Sage Ranch Ct SW
- 9620 Sage Ranch Ct
- 9901 Morning Sun Trail SW
- 2503 Sancho Panza Way SW
- 1727 Desert Ridge Rd SW
- 1719 Desert Ridge Rd SW
- 1715 Desert Ridge Rd SW
- 8715 Silverado Ave SW
- 1709 Desert Ridge Rd SW
- 8716 Lone Prairie Ave SW
- 1720 Waters Dr SW
- 1724 Waters Dr SW
- 8804 Silverado Ave SW
- 1716 Waters Dr SW
- 8800 Silverado Ave SW
- 8808 Silverado Ave SW
- 1705 Desert Ridge Rd SW
- 8709 Silverado Ave SW
- 8712 Lone Prairie Ave SW
- 1712 Waters Dr SW
- 8900 Silverado Ave SW
- 1701 Desert Ridge Rd SW